
by Judith Curry
A new paper on sea level variations over the past two millennia is receiving substantial attention.
Climate related sea-level variations over the past two millennia
Andrew C. Kemp, Benjamin P. Horton, Jeffrey P. Donnelly, Michael E. Mann,
Martin Vermeer, and Stefan Rahmstorf
We present new sea-level reconstructions for the past 2100 y based on salt-marsh sedimentary sequences from the US Atlantic coast. The data from North Carolina reveal four phases of persistent sea-level change after correction for glacial isostatic adjustment. Sea level was stable from at least BC 100 until AD 950. Sea level then increased for 400 y at a rate of 0.6 mm/y, followed by a further period of stable, or slightly falling, sea level that persisted until the late 19th century. Since then, sea level has risen at an average rate of 2.1 mm/y, representing the steepest century-scale increase of the past two millennia. This rate was initiated between AD 1865 and 1892. Using an extended semiempirical modeling approach, we show that these sea-level changes are consistent with global temperature for at least the past millennium.
The full PNAS paper is available here [link].
Coauthor Stefan Rahmstorf has post on this paper over at RealClimate. The paper is generating some controversy, notably AMac’s comment that the disputed Tiljander proxies were included in the paleo temperature analysis used in the paper. Spiegel online (translated by GWPF) has an article entitled “New Sea Level Study Divides Climate Researchers.” The main points raised are:
They see a major problem of the new study in the fact that it is ultimately based only on the finding from the coast of North Carolina. That could be too limited for a statement regarding global developments. “This study is therefore not suitable at all to make predictions,” says Jens Schröter from the Alfred Wegener Institute for Polar and Marine Research.
Rahmstorf and his colleagues concede that local sea-level fluctuations may differ from the global average. Nevertheless, the scientists expect that their data show broadly the changes in global sea level. Schroeter, however, argues that over a period of more than 2000 years the influences of continental drift and the so-called isostatic rebound will be felt. This is a consequence of the last ice age: with the disappearance of the glaciers, the land masses were liberated of such a large load that they still perform a rocking movement. In Scotland, some areas were lifted by up to 60 centimeters during the last century, while parts of southern England and the French Channel coast sank by the same amount.
The new sea-level reconstruction study also differs significantly from previous studies. In a study published in 2008, a team led by Michael Mann, who is also one of the co-authors of the current study, calculated a much steeper sea-level rise for the past few centuries. For the year 500 AD, the estimated sea level was calculated to be nearly one and a half meters below the new value. Rahmstorf himself had also published studies on the historical development of sea levels in 2007 and 2009, which also deviate significantly from the new calculation.
Mojib Latif from the Leibniz Institute of Marine Sciences (IFM-GEOMAR) refers to the observation period of roughly 2000 years as “a strength of the study.” But the long-term natural fluctuations in sea level are still poorly understood: “What happened to sea level fluctuations during periods of 300 to 400 years is highly controversial.”
My main criticism of the paper is related to the use of the simple model that relates global average sea level rise to global average surface temperature. Several months ago, Bart Verheggan had a good post on this topic. Jeff Masters has a must read post on global sea level variations. Tonyb sent me a link to this summary diagram of different global sea level rise reconstructions for the 20th century. Tonyb also provides a link to an analysis of global sea level rise by David Burton. Tonyb also has a 2010 post at WUWT that examines the provenance of the IPCC AR4 analysis of sea level rise.
After looking at all this, I have a hard time finding much empirical rationale for a relationship between global average surface temperature and global sea level that makes sense over the range of sea level for the past several thousand years.

jc – “I have a hard time finding much empirical rationale for a relationship between global average surface temperature and global sea level that makes sense over the range of sea level for the past several thousand years.”
How about just finding a physical rationale for such a relationship, based on the crazy idea that water expands and more ice melts if it’s warmer.
Just a thought. You’re the expert.
How about just finding a physical rationale for such a relationship
Yup- that’s what she said. Look up empirical.
It is interesting that PNAS (Proceedings of the National Academy of Sciences) published the paper. I suspect that many NAS members are feeling uncomfortable with the direction that the NAS President is taking that once great organization.
NAS is self-described as “an honorific society of distinguished scholars.”
http://www.nasonline.org/site/PageServer?pagename=ABOUT_main_page
The climatologist, Dr. Ralph J. Cicerone is President of the National Academy of Sciences and Chair of the National Research Council.
http://www.nasonline.org/site/PageServer?pagename=ABOUT_President
Does anyone know when his term of office ends?
With kind regards,
Oliver K. Manuel
Frankly this entire global climate scandal sprouted from manipulating and ignoring high-quality, space-age data on the origin of Earth’s heat source – the Sun – in the 1970s.
It has now been generously watered and fertilized with public tax funds for almost four decades.
There is little or no chance of ending the scandal while government scientists continue to water and fertilize the AGW story.
Oliver K. Manuel
Former NASA Principal
Investigator for Apollo
So simple!
http://youtu.be/xEGhXZnI07o
haha Mann as Gilligan.
Tiljander is in the house! calling Amac
I wonder if they know the story of The Blind Men and the Elephant
Perhaps you are referring to the thermal expansion of sea water. This is something that is easily calculated from the thermal expansion coefficient of sea water, provided that you know the depth of the warming (which isn’t easily calculated). If it was easily calculated, people developing these relationships would make simple calculations rather than use measurements. The point is that there are other factors apparently dominating, given the relatively stable climate in recent millennia, with thermal expansion not playing a dominant role.
you said: given the relatively stable climate in recent millennia,
I would say given the extreme stable climate in the past ten thousand years.
Based on Antarctic Ice core data, all within plus or minus two and most withing plus or minus one degree
Are the waters of the oceans really warming – and therefore expanding – to any extent at all? To the best of my current appreciation, the Argo system of drifting buoys has reported a general decline in ocean temperatures throughout the top 2,000 meters of studied areas.
It appears to be flat for the past 8 years, but not declining. There have been previous up and down fluctuations as well. The ARGO data are principally from the top 700 meters, although ARGO can sample deeper.
The NOAA chart allows you to click on the thermosteric sea level data as well as heat content data. The two parallel each other fairly accurately, consistent with the important role of thermal expansion as a determinant of sea level changes in the long term.
“The paper is generating some controversy, notably AMac’s comment that the disputed Tiljander proxies . . .”
AMac is obsessed with the Tiljander proxies, but has never been able to formulate any kind of a scientific argument against the way they are used in climate reconstructions.
As Oliver is to the sun, AMac is to the Tiljander proxies; logorrhea sans insight.
Read Mia’s paper and you’ll understand why Tiljander cannot be used as Mann uses them. even gavin agrees that they have no merit prior to 1000. Kaufman even agrees.
but the zombie lives
in this case it causes a divergence prior to 1000.
Robert wrote, “AMac is obsessed with the Tiljander proxies, but has never been able to formulate any kind of a scientific argument against the way they are used in climate reconstructions.”
Robert appears to be implying that there are plausible scientific arguments in favor of the way the Tiljander data series are used in the climate reconstructions presented in Mann08.
If that is his claim, I applaud him — it’s the strongest possible defense of that paper, thus also of subsequent papers that rely on its reconstructions. (The authors of Kemp11 chose to compare their sea level findings to “Composite EIV global land plus ocean global temperature reconstruction” (see Figs. 2A, 4A, S3,S4, and S5). This recon is from Mann08’s S.I. figure S6, panel F.)
It is perhaps noteworthy that “There are plausible scientific arguments” is rarely if ever advanced by knowledgeable defenders of Mann08’s use of the Tiljander data series.
Instead, it’s proposed that ‘We can’t know one way or the other’, or ‘It doesn’t matter’, or ‘It’s too complicated for non-experts to grasp.’ Ad hominems also make an appearance.
The difficulty may be that the strong assertion “There are plausible scientific arguments in favor of Mann08’s use of the Tiljander series” invites obvious follow-on questions that have only unsatisfying answers.
I have laid out the problems with how Mann08 employed the Tiljander series at my blog. One can start with yesterday’s The Tiljander Data Series Appear Again, This Time in a Sea-Level Study and work out from there. Good discussion in the comments, too.
I think maybe a long piece for dummies, get popcorn. Personally I was pleased with how quickly I spotted the divergence in SI. Funny as hell.
The Siltdown Mann
“The Siltdown Mann”
We shouldn’t expect less from the co-author of The Crutape Letters.
I’ve taken grief since 2007 for saying the Piltdown Mann I might as well build on that trope.
The point is this. These things like Tiljander are damn hard to get out of “science” once they get in. The Piltdown man, suspect from the start, lingered on in science for decades. Once something gets accepted ( even if it’s a hoax) it is frightfully hard to eradicate, especially if the battle over it is political and ‘religious’.
So, no Siltdown is not a hoax. But Bad science is just as hard to remove as fraudulent science, when other factors are at play.
Interestingly enough when others asked to see the bones they were denied access.
I have my students write short research papers on the Piltdown Man so that they will always be skeptical of scientific claims. Bernie Madoff proved there has been no decrease in the public’s susceptibility to flimflammery since the Piltdown Man. I also teach my kids about the extreme dangers of relative risk studies and how the medical establishment uses them to sell product.
Interesting assignment. What I would ask them to look at are the parallels between the hockey stick and the Piltdown. NOT with the intention of showing the HS is a fraud. It’s not. But rather looking at the sociology of the thing. How did the community react. why did the fraud stay in he literature for so long ( even AFTER it was debunked), what the real fight was about, and how science can survive a fraud or even a really bad pirece of science. It’s a great example of how mistakes get accepted.
Siltdown Mann. I like it! That’s a keeper.
Credit Moshpit
of course!
The ‘obsession’ is the equivalent of claiming up is down and down is up and neither makes any difference.
Only to someone not bothered any reality would it not make any difference.
Robert, here’s my abbreviated explanation why the use of Tiljander is wrong.
The Tiljander study measured sediment thickness which was proposed as a proxy for temperature. Unfortunately, the original authors had showed that the sediments representing the modern thermometer era had gradually morphed into a proxy for human activity: farming, ditching, foresting, bridge building. It had become a proxy of a proxy for temperature and an inverted one at that (thicker varves no longer meant cooler).
Mann processed the data using a statistical method which found the bogus correlation in the thermometer calibration period… and it produced an inverted temperature reconstruction! Now, if an inverted reconstruction is averaged with a non-inverted reconstruction the cancelling of differences approximates a nice hockey stick handle. And a fuss started when McIntyre and McKitrick tried to point all this out to PNAS.
But Man explained, “The claim that ‘‘upside down’ data were used is bizarre. Multivariate regression methods are insensitive to the sign of predictors…” And PNAS apparently agreed.
Yet, while Mann’s statement was true, it was not germane. MRA does not fix corrupt datasets. Nor does it interpret a weird (and perhaps desirable) outcome. Most astonishing of all is the absurd opera which has played out where undeniably bright AGWer scientists still claim they are unable to understand the problem.
Correction: Mann’s statement is more accurately described as truish.
Perhaps an impossibility – but do you know of a summary of this discussion that could be understood by someone not well-versed in statistics (and who is prone to weak arguments, I might add)?
No. But if there was no science AND no snark, would anybody actually read it?
I rewrote my prior post into a ‘Tiljander for Joshua’. No statistics references! I predict no one reads it.
Mia Tiljander is a Finnish researcher who studies the thickness of annual lake sediments (varves). Varve thicknes is an indication of the amount of erosion that has occurred. Tiljander believes the primary factor determining ancient erosion in Finland is the intensity and duration of spring flooding. So, the extent to which colder years are associated with more snow and thus more intense spring run-off, will determine the usefulness of varves as a winter temperature proxy. This could be iportant as winter information is missing from reconstructions based on tree-rings, which are presented as more about summer temperatures. The relationship, although nonlinear is: thicker varves indicate colder temperatures.
Tiljander pointed out a serious issue with the more recent portion of the varve dataset. Human activities such as farming, ditching, foresting and bridge building significantly influence erosion. In fact, recent human activities overwhelm the natural signal.
These same human activities are also proxy for temperature. That is, as temperatures increase, so do human populations and soil erosion. Longer growing seasons mean that land once not suitable for agriculture is actively developed. And growing seasons (and local temperatures) can be increased by ditching to drain fields earlier. Strangely, the relationship of temperature to varve thickness had changed: thicker varves indicated warmer temperatures. At the crossover point where thicker no longer means cooler, the varve dataset appears to be ‘twisted’.
Michael Mann used Tiljander’s data to create a reconstruction of past temperatures. Now it is widely assumed, but not proved (so far as I know), that Mann actually read the Tiljander study prior to borrowing the data. To be fair, he may have acquired the data third hand, the accompanying notes written in Finnish. Regardless of foreknowledge, the continued use by Mann is controversial because the twisted dataset supplies upside down, non-germane data in the time period over which varve thickness is compared to thermometer temperatures (for the purpose of establishing a reliable PAST relationship between the two).
The natural outcome of using this twisted dataset is a twisted result. Past temperatures indicate warmer where they ought to indicate cooler and vice versa. The results are inverted. When inverted reconstructions are combined with noninverted reconstructions it erases information and replaces it with a nice hockey stick handle.
McIntyre and McKitrick tried to point all this out within the 250 word limit allowed by PNAS.
But Mann retorted, “The claim that ‘upside down’ data were used is bizarre. Multivariate regression methods are insensitive to the sign of predictors…” [Translation: My data could not have been upside down during the calibration period because…blah…blah… …blah…blah.]
And PNAS apparently agreed.
Yet Mann’s big words were irrelevant because no analytical tool will automatically fix this sick, twisted dataset. A tool mechanically trusts that scientists know what they are doing and that what they are doing is proper. A tool will not interpret the weird (and perhaps desirable) outcome resulting from using such a dataset.
Most astonishing of all is the absurd opera which has played out where undeniably bright CAGWer scientists still claim they are unable to understand the problem.
I read it! And I thank you very much for that.
Rust – The global temperature has increased over the past 100 years and so there must have been thermal expansion of sea water due to that warming. The ice melting issue is more complicated. Many studies indicate an acceleration of glacier melting during the past century, but melting was already underway before that time. In addition, Antarctica, which holds most of the world’s ice, appears to have been gaining mass until fairly recently despite the fact that it was undergoing a slight warming trend. In part, the phenomenon perhaps reflected the isolation of the continent by circumpolar currents and a translation of increased temperature into increased evaporation and subsequent snowfall rather than increased ice loss. Only in recent years has there been clear evidence from the GRACE measurements that Antarctica is losing land ice at a substantial rate.
At this point, ice melting is almost certainly adding volume to sea water on a multidecadal basis, despite bumps and dips in sea level measurements over short time scales. The same principle applies to the thermal effect (“steric sea level”), although again, trends are punctuated by bumps, dips, and flat intervals.
One of better resources for pursuing information of various aspects of sea level is the University of Colorado Sealevel site. Whether their current estimates of sea level rise at about 3.1 mm/year (with a recent downturn), based on altimetry data, are a better guide than historical tide gauge measurements, is likely to be a matter of controversy, but I do agree with you that long term, a relationship relating global temperature to global sea level is an inevitable consequence of the physics, although the quantitation remains to be fully determined. The UC site provides data on the thermal expansion (steric) component of sea level rise, which appears to have increased since mid-century, but again with a recent dip coincident with flat temperatures of recent years. Because of fluctuations in both temperature and sea level measurements that occur over short intervals, trends are difficult to estimate from data spanning less than a decade.
@fred
Surely the best you can really say is that
‘the global atmospheric minimum nighttime temperatures over land’
have increased a soupcon in 100 years. Nobody (AFAIK) has been able to show what you claim for sea temperatures.
Latimer – Ocean temperatures have been measured for many years by ships and buoys sampling bulk ocean surface temperature, by ships measuring night-time marine air surface temperature, more recently by satellite measurement of ocean skin temperature, with surface measurements complemented by the upper ocean heat content data of Levitus et al for decades, and more recently the heat content data from the ARGO floats. Agreement among the methods is imperfect, but the conclusion that ocean temperatures have risen over the multiple decades of the past half century (and probably before) is not really in doubt. The more salient issues involve the shorter term deviations from the trend, and the question as to how much they reflect sampling or methodological variation as opposed to significant climate variability. The latter include ENSO induced variations but probably other climate dynamics that are less well characterized.
A lot of words to say that the precision methods and results are dubious.
A lot of words without any numbers.
Fred
It is simple
Sea temperatures have not been measured over a period of 100 years. Since sea represents over 70% of the global area, my point stands
All the rest of your post is, as ever, lengthy handwaving
The best you can find to say is
‘Agreement among the methods is imperfect, but the conclusion that ocean temperatures have risen over the multiple decades of the past half century (and probably before) is not really in doubt’
which is just an assertion, not evidence and even if verifiably true really only covers 50 years., not 100
No, only if the oceans have warmed.
They have not warmed much at all.
Certainly you understand the difference between air temps and water temps?
Over the past century, ocean temperature change and global surface temperature change have been quantitatively very similar. The latter is routinely measured as a surface air temperature anomaly. Over the oceans, bulk ocean temperature, skin temperature, and air surface temperature trends parallel each other fairly well. The concordance between ocean and global temperature anomalies is not surprising, because the oceans occupy about 70 percent of the Earth’s surface area. They also store most of the heat added to the climate system.
You mean that air temps and ocean temps have moved negligibly, trivially and and insignificantly and can be well explained by historically typical variations?
Does this mean we can get some of our money back from the IPCC/AGW industrial complex?
“Over the past century, ocean temperature change and global surface temperature change have been quantitatively very similar. ”
Odd, the quality of the sea surface temperature before the satellite era doesn’t look all that impressive to me.
Why is the sea level rise so asymmetric?
“The reason that some satellites show a rise in sea level is because of a “hot spot” north of Australia which skews their numbers way up. Tide gauge data from the region shows nothing of the sort.”
http://stevengoddard.wordpress.com/2011/06/19/satellite-sea-level-data-is-crap/
Is it actually rising in only one region or is the code analyzing the data crap?
Or is the satellite calibration wrong? BTDT
Fred: Pre-Argo, I don’t think we have measured the rise in ocean heat content accurately enough to have anything but the vaguest idea about the thermal component of sea level rise. The NOAA chart you cited above shows that 9 mm of sea level rise could be attributed to thermal expansion between 2001.5 and 2004.5; a rate of 3 mm/yr – the essentially the entire observed sea level rise during those years. From 1972-2010, 22 mm of sea level rise is attributed to thermal expansion, about 0.5 mm/yr.
AR4 says that about 50% of sea level is due to thermal expansion. However, if one looks at the 90% confidence intervals (1.6+/-0.5 mm/yr thermal out of 3.1+/-0.7 mm/yr total observed 1993-2003), thermal expansion amounts to 52+/-28% of sea level rise. Expressed conservatively, the expansion component is somewhere between 1/4th and 3/4’s. From tide gauges and satellite altimetry, we have a more precise record of total sea level rise than we have of ocean heat content (and therefore thermal expansion).
The relationship between surface temperature and ocean heat content is even more obscure. For example, there is no surge in ocean heat content associated with the 1998 El Nino.
On some time scale, there logically should be a connection between surface temperature and sea level rise due to thermal expansion. Given natural variation, the limited reliability of measurements of ocean heat content, and the controversy over millennial temperature reconstructions, I personally see no reason to believe that this connection has been demonstrated and characterized by observation.
Frank – Thanks for your thoughtful comment. I agree that steric sea level and OHC are beset with considerable uncertainty, as you point out. The pre-ARGO Levitus OHC data are certainly less reliable than subsequent data, but the multidecadal trends are hard to dismiss as anything other than a rise in OHC. On the other hand, even with ARGO, I’m not sure we know how to interpret short term fluctuations of less than a decade. My overall conclusion is to agree that the relationship between surface temperature and steric or overall sea level is not yet quantifiable in very precise terms, but I don’t agree that there is no observable relationship of the kind theory leads us to expect.
Regarding the 1998 El Nino, I’m not sure how that should have affected OHC. An El Nino exposes the ocean to increased heat loss to the atmosphere, and so an initial response would include a tendency toward OHC loss. However, feedbacks involving water vapor, ice/albedo, and perhaps clouds from a warming atmosphere and ocean surface will tend to promote OHC gain. The net effect is likely to be complex in terms of both timing and location, but I haven’t seen a detailed analysis.
I’m afraid I cannot see the relevance of this paper to anything much, beyond Mr Mann trying to use his “hockey stick” shape to demonstrate some bizarre kind of cross-discplineral correlation.
There is already a worldwide metric for sea level rise that is perfectly serviceable without recourse to somewhat questionable paleontological hind-casting. If it is left untarnished – hopefully the really rather bizarre 0.03mm “adjustment” will soon be removed – this will serve us all far better than yet another “scenario”.
I had hoped, in vain it seems, that the debate had moved on from the abstract and more into the realms of policy.
To use a common analogy of yours, Dr Curry, this is just another attempt to describe the “Dragon”. The truth is we, the great unwashed, well understand the tale of the Dragon and are unlikely to be swayed to conscripting an army to defeat it until such times as we actually see the beast in the flesh…..ie: until there is physical evidence of extraordinary danger from rising sea levels, we will just go on doing what homo sapiens does, adapting to our surroundings.
In the meantime – and I can’t resist this – Mann’s Dragon stories are just the boy crying “wolf”, yet again.
oops – of course I meant 0.3mm per year, not 0.03!
“some bizarre kind of cross-discplineral correlation”
What exactly do you find bizarre? That there might be a relationship between temperatures and sea levels, or the practice of collecting evidence in world to better understand the world? Perhaps it is the collection of multiple independent lines of physical evidence to support a hypothesis, which is a much more important part of regular science than blog science.
The constant use of superstistics to conclude the earth is warming abnormally due to fossil fuels is very bizarre.
So – you DO realize that AGW is actually a hypothesis :-)
Steve has a post up at ClimateAudit concerning the double standard exhibited by PNAS between LIndzen paper and this current sea level paper.
http://climateaudit.org/2011/06/22/pnas-reviews-preferential-standards-for-kemp-mann-et-al/
http://www.dailymail.co.uk/sciencetech/article-1066712/Uncovered-lost-beach-Romans-got-toehold-Britain.html
This Roman port is two miles inland. Southern Britain has been sinking since the end of the last ice age, due to the isostatic rebound following the melting of the ice on the north of the mainland. Sea levels were therefore higher in Roman times than they are now.
This paper should be filed in the round cabinet.
Just to make the logic explicit, if the port is 2 mi. inland, the sea is sinking much faster than Southern Britain.
Read the article. It’s in a place called Kent, near Sandwich. The site is along the River Stour, and it looks like it’s along a railroad track. Looked for it on Google Maps. Found it. The sea is not very far away.
It says the coastline was altered a few centuries ago.
The area’s vulnerability to occasional earthquakes was confirmed by Professor Bill McGuire, director of hazard research at University College London. ‘Two big quakes shook the Dover Straits in 1382 and 1580, reportedly causing widespread damage in adjacent areas of England and France,’ he said.
Sorry, I’m removing the paper from the trash can.
What are you talking about? Kent is a county. Sandwich is a town in Kent.
He linked to a story about a Roman ruin that has a beach – 2 “miles” inland, and threw away the paper.
Why the square quotes? The article I linked states unequivocably that this roman era beach is two miles inland.
North Carolina has been hit by at least 403 hurricanes and cyclones.
I doubt those salt marshes are even close to where they once were.
http://en.wikipedia.org/wiki/List_of_North_Carolina_hurricanes
Back in the trash can …
Can you link to a paper about hurricanes and sediment cores?
“Hurricane Andrew made landfall on the Louisiana coast on August 26, 1992, with the eye passing 40 km southwest of a salt marsh pond already under study. Storm surges ranging from 1-3 m in proximity to the pond resulted in the deposition of a mud layer, several centimeters thick, in many areas inundated by the storm surge. Analysis of pond sediment cores distinguished a hurricane mud layer characterized as a composite sediment, containing indicators of estuarine, brackish, and freshwater sources. The composite nature of the hurricane sediment is indicated by a higher diatom species diversity coupled with a more even species representation. Other distinguishing characteristics of the mud layer include lower marine diatom abundance, larger mean grain size, more poorly sorted sediment, and lower amounts of nitrogen in the sediment. Hurricane Andrew appears to have altered the geochemistry of the pond through the reduction of sulfide in the sediment allowing the proliferation of aquatic submerged flora (Najas sp.), resulting in a diatom assemblage shift towards epiphytic species. The submerged stand was still present two years after the hurricane landfall, and the diatom population has yet to revert to the pre-hurricane community.”
http://www.jstor.org/pss/4298846
Well ok, you can compost it or whatever if you prefer. If you think a local quake could have *lifted* southern England out of the channel against the long term sinking it has been undergoing since the last ice age then you are straw clutching IMO.
There’s lots more evidence of rising and subsequent falling of sea levels bracketing the Roman Warm Period around Europe. Here’s a great page on ancient salt making:
http://www.salt.org.il/frame_arch.html
“The port of Rome, Ostia, was moved inland at least three times, leaving historians with the evidence of this sea level rise….Other coastal towns like Ravenna and Aquilea, previously deep inland, turned into ports and were among the few ports situated near saltworks to survive in Italy, only to later become landlocked again, for the coming centuries, high and dry and about 10 km from the coast.”
You can invoke earthquakes if you like, but it looks like special pleading to me, and requires a belief that they all went in one direction, uplifting the land. Unlikely in the extreme.
Yes, there is a lot of interesting material in this article, showing that there was significant sea level change in Roman times. For example
“Phalasarna like most of the other harbours was finally completed with the addition of an interior harbour basin to cater for the catastrophic rise in sea level, and like those other harbours the basin is now well above present day sealevels and completly dried out.”
Historical evidence such as this is useful, since the writers clearly have no interest in climate change in itself, and so can be regarded as unbiased sources. The same cannot be said of Mann and Rahmstorf – their ridiculous paper is another gift to the skeptics!
Paul, yes indeed, no climate axe to grind there. STrange how the folk from the warm side wander off when you show them something interesting like that!
Or even more explicitly, the sea level fell after the Roman Warm period, in the dark ages and little ice age, then rose again to the modern level.
This is the first time i’ve come across isostatic rebound. Fascinating (and obvious when you think about it).
“In areas formerly covered by ice sheets (around the Baltic Sea and Hudson Bay, for example), sea cliffs and beach ridges are now found nearly 300 m (1000 feet) above sea level! 14C ages on marine shells and driftwood show that these features are postglacial (less than 14,000 years old). They were formed at sea level and, even though eustatic sea level has risen, they have risen far more from isostasy.”
http://www.homepage.montana.edu/~geol445/hyperglac/isostasy1/
The Hockey Stick is dead, long live the Hockey Stick!
Interesting. Events which took place in Europe (MWP, LIA) are almost certainly regional, but events which took place in North Carolina are almost certainly global?
Zing!
That sir, was a beaut.
Gene, the emperor’s teleconnections can only be seen by those who are sufficiently worthy. If you can’t see why North Carolina data is global and European data is only regional, you obviously are unworthy to understand climate and CAGW. It takes a very special kind of person to save the planet and all living things. Thankfully, the members of the team are worthy enough to have that special kind of understanding.
I wonder if Bernie Madoff can start an investment letter as long as he doesn’t handle investments directly?
As always consider the source.
Interestingly, I think a chart of Bernie’s hedge fund value was a hockey stick.
Ouch.
Actually Madoff could start an investment letter. Here in the US, we have freedom of the press. But who would buy it?
There are commenters at Climate Etc. who might tell you of people who “buy” improbable climate papers.
http://stevengoddard.wordpress.com/2011/06/21/scientific-bullshite-deepest-in-at-least-2100-years/
I think it is interesting that the Sea Level experts seem to think I would care more about the total volume of water in the ocean instead of sea level relative to land. Global Isostatic Adjustment? I thought the concern was sea water flooding people out of places that are currently dry.
perhaps people should move
Yep, but I bet they won’t move unless the water rises. Of course, that live on sea coasts know sea level varies over time. The notice it twice a day. They notice it with the phases of the moon. They know there are longer term changes. I doubt 7 inches rise a century will surprise many of them.
Oops,
should read: “Of course, those folks that live on sea coasts know sea level varies over time. They notice it twice a day….”
Apologies in advance for an off-topic post – but I figured some folks here might be interested.
Anthony Watts has a post up criticizing “Lord” Moncton for invoking the swastika to demonize those who think that GW might be A. I must say, given Watt’s level of animosity for AGWers, I was a but surprised, although pleasantly surprised by the post.
What I’m not surprised by is the string of comments in support of Monckton, ranging from saying that he’s only wrong because he chose the wrong kind of fascist for his analogy, to whining “Mommy, mommy, they did it first,” to saying there’s really no big deal about a swastika, to saying basically that all’s fair in war.
Ah yes, that “vast asymmetry” in the tribalism rears its head once again.
Joshua | June 22, 2011 at 5:57 pm |
Anthony Watts has a post up criticizing “Lord” Moncton for invoking the swastika to demonize those who think that GW might be A. I must say, given Watt’s level of animosity for AGWers, I was a but surprised, although pleasantly surprised by the post.
What I’m not surprised by is the string of comments in support of Monckton, ranging from saying that he’s only wrong because he chose the wrong kind of fascist for his analogy
At WUWT
Joshua says:
June 22, 2011 at 2:32 pm
Hey – what’s the big deal about the use of a Swastika? Why all this political correctness, Anthony?
(bold my emphisis)
You made some of those comments. So that’s why are you were not surprised?
Given the animosity that Anthony usually expresses (and engenders) for people who think that GW might be A, I was surprised that he would post such a criticism of Monckton. All due credit, however.
I was not surprised by the comments. I guess you didn’t realize it, but the string of comments I left were “concern troll” comments, satirizing the string of similar comments left by WUWT readers. Here’s one example:
That’s weird. I believe in AGW and Anthony doesnt express ANY animus my way. He allows me to post articles on his site that are critical. Thinner brush, that broad one draws ugly pictures
And I DON’T believe in CAGW – and my posts are always held for moderation.
???
Are you responding to something you think I said about having comments held for moderation?
no he’s not responding to you..
Uh…
WUWT is a moderated site. Every comment is held for moderation except those by the moderators, the admins, and the guest posters.
CTM –
I understand that. Joshua is apparently just being supersensitive.
????
Seriously, what are you talking about?
Did I write come complaint about my comments being in moderation that I am unaware of?
No – I wasn’t talking to you. As I said – supersensitive tonight, are we?
he thinks your responding to him. weird
Joshua,
When you post stuff that is simply untrue, you do not look brighter.
When you do post fibs, you should try and make them hard to bust so quickly.
Joshua, when well financed AGW supporters produce films showing children and skeptics blown up at the touch of a button, and AGW believers suggesting skeptics be tattooed like concentration camp victims and AGW believers writing that skeptics should be asphyxiated/poisoned by CO2 and CO then comparing AGW believers to nazis is ok with me.
http://www.independent.co.uk/environment/nature/climate-change-film-blows-up-in-richard-curtiss-face-2096801.html
http://wattsupwiththat.com/2011/06/09/silly-nazi-hijinks-lets-tattoo-deniers-for-the-grandchildren/
http://wattsupwiththat.com/2011/06/22/facepalm-more-casual-death-wishes-from-australia/
Ah yes, the “Mommy, mommy, they did it first” defense.
I knew I could count on someone to come through.
When environmentalists spearheaded by Rachel Carson have killed over 100 million people by banning DDT … a nazi reference is quite justified.
Bruce –
A “Staliinist” reference is even more justified – after all, he killed more than the Nazis although not as many as the progressive/left environmentalists. . It’s also more appropriate politically and less volatile on the Internet.
Thanks, Jim.
Now Judith, about that “vast asymmetry” in the tribalism….
Define the term “vast asymmetry”.
Vast Asymmetry:
Skeptic: Lets have debate
AGW cult leader: Lets throw all the deniers in jail!
“David Suzuki has called for political leaders to be thrown in jail for ignoring the science behind climate change.
At a Montreal conference last Thursday, the prominent scientist, broadcaster and Order of Canada recipient exhorted a packed house of 600 to hold politicians legally accountable for what he called an intergenerational crime. Though a spokesman said yesterday the call for imprisonment was not meant to be taken literally, Dr. Suzuki reportedly made similar remarks in an address at the University of Toronto last month.”
http://www.nationalpost.com/news/story.html?id=290513
And David Suzuki of all people (he has actually been in an internment camp) shouldn’t be saying such things.
But exhorting his followers to jail his “enemies” …. sounds like fascism to me.
Thanks, Bruce.
Now Judith, about that “vast asymmetry” in the tribalism….
Thw WUWT thread shows about an even number of those who approve/disapprove of Monckton’s reference. And in the debate those with opposite opinions are able to disagree agreeably. Unlike, say, Gavin Schmidt in his attitude to Judith.
Now can you understand the asymmetry Judith refers to?
Not that you’d admit you could, even if you did…
Mr. Tallbloke – sorry, but I reject any “Mommy, mommy, they do it tooooouuuuu” defense out of hand.
I would never excuse Gavin’s treatment of Judith by listing the stream of insults directed his way daily in the “denier/skeptic” blogosphere. Bad behavior is, simply, bad behavior.
In point of fact, the “asymmetry” that Judith refers to is based on what I believe to be a false distinction between the political and scientific elements of the debate. My point is that on both sides such a distinction is impossible, and that the “asymmetry” she describes is in contrast to human nature – which dictates that everyone has tribalistic influences in their reasoning processes – requiring at least good faith efforts to control for those influences. “Skeptics/deniers” claim that it is unfair for “the climate establishment” to exclude their input on the basis of credentialed scientific expertise, yet they seek to disassociate tribalism evidently displayed by their “non-elitist” bretheren as so evidently displayed at the WUWT thread in question. WUWT, perhaps the key amalgamation of “denier/skeptic” perspective is, in fact, largely driven by Anthony’s abundantly apparent political orientation, yet unfortunately, few skeptics (as distinguished from deniers) seem to be interested in acknowledging that element of tribalism. As another example, we see on another thread “skeptics/deniers” holding forward Willis’ technical analysis of the recent paper on sea level rise, yet we hear very little about Willis’ tribalistic ranting about Muller.
As for the “equal number” defense – are you really untroubled that some 50% of WUWT’s commenters approve of Monckton’s use of Nazi analogies, and that many of them go further to offer rationalizations for why using such Nazi references are justified, accurate, shouldn’t be considered offensive, etc.?
You seem to have a fairly low standard.
Joshua,
So many words by you to say nothing except that you get to do whatever you want and pretend the meanie skeptics are to blame.
Joshua –
Mr. Tallbloke – sorry, but I reject any “Mommy, mommy, they do it tooooouuuuu” defense out of hand.
Still in kindergardrden mode, eh.
I would never excuse Gavin’s treatment of Judith by listing the stream of insults directed his way daily in the “denier/skeptic” blogosphere. Bad behavior is, simply, bad behavior.
Few of us need to direct “insult” at Gavin – much less lies. The truth is sufficient. And stating the truth, regardless of how repugnant it is to you, is neither insult nor lie.
For the swastika garbage – I was one of those who objected strenuously to the use of the word “denier” (the two ARE related) several months ago on this blog – as I have in other places. You, on the other hand, started your career by using that word and defending the usage – so…. any objections you have here are nothing but hypocrisy.
Then we can talk about “tribalism” — and the fact is that few , if any, take you seriously simply because your own “tribalism” is so obvious and obnoxious.
In fact, your tribalism is illustrated vividly by your “Mommy, mommy…” nonsense. I reject your rejection – for the simple reason that I consider it nothing but another progressive ploy to shut off the debate.
I’ll repeat – Still in kindergardrden mode, eh.
And correct me if I’m wrong, Mr. tallbloke – but did you not, yourself, post a comment praising Monckton’s strategic rhetorical skills for using the Nazi analogy?
What’s going on here? You obviously disapprove of Gavin’s attitude towards Judith yet you applaud Monckton’s use of swastikas?
Please explain.
Joshua,
You are too shy.
You defend the use of ‘denier’ as the proper name calling term for skeptics.
You really really really have nothing more to say on this.
ciao,
I praised his strategic skill in apologising afterwards.
And when he apologised he asked when will we see apologies forthcoming from those who liken sceptics to holocaust deniers? Or recommend suggest they end their lives breathing high levels of co2 or co? Or recommend they be forcibly tattooed? Or say they should be imprisoned?
You are one of those people who liken people who have a different understanding of climate to you as being like holocaust deniers Joshua.
Have you got an answer for Christopher Monckton
Or will you just continue your childish name calling?
Joshua,
Where is your outrage at what your side did?
YOu have a lot of chutzpah daring to tell skeptics to do something, and lie abnout the example at the same time.
Deal with your own fellow believers.
Otherwise, STFU.
Now hunter – I’ve already spoken to you about those “Mommy, mommy, they did it fiiiirrrrssssttt” posts.
And tell me, hunter, what do I “believe?”
Joshua,
Perhaps you are playing with that little voice in your head more than you think.
You have offered no meaningful advice, and you are obviously too cowardly – or poorly talented?- to deal with the nasty little coreligionists of your AGW.
What you believe? The pile of garbage summed as AGW.
Enjoy, little Josh.
Joshua –
Do you have anything substantive to say? Or are you just into kindergarden mode tonight?
This seems to address the Green/Nazi similarities. Read and form your own conclusions.
http://jonjayray.tripod.com/hitler.html#1119
Tom –
Thank you. It feeds my confirmation bias :-)
technically, hes not saying they did it first. he’s asking you to deal even handedly with the idiots on both sides. Until I see you criticize both sides even handedly I have to question your objectivity…hmm where have i heard that argument before???
thats right, thats the one you use against judith.
hunter –
There’s no outrage because he fails to understand what was done. Or how it degrades science in general. Or how it drags climatology further into the morass of bad science and unethical behavior. All of which weaken the case for his own beliefs with anyone who has any sense of reality.
It’s a common phenomenon to (mostly) his side of the debate.
I don’t think the defense they make is “they did it first”. Put in context, I take these responses to be more like “they did it too” which really isnt seen as a defense, but rather as a call for even handedness. Stupid people on both sides.
So if someone on your side recommends politicians be jailed for not agreeing with everything your side says about climate change, we should immediately call for that persons head to be removed …
That would be even handed … right?
And so Bruce falls to Godwin’s Law.
It’s a mercy killing, really; nobody has to untangle the many lies and distortions he’s offered up so far.
People who fantasize about mass murdering their opponents are just fine with you. No surprise.
Bruce,
Robert just had the high point of this thread.
Now he can pretend that none of what his guys do matters because you allegedly triggered Mike Godwin’s law (observation).
But for Robert, the problem of course is he had nothing else to do but hope he would be able to claim Godwin was ‘violated’.
Looks like Vermeer and Rahmstorf were limbering up in in 2009 as they published a paper headed ‘global sea level linked to global temperature.’
http://www.pnas.org/content/106/51/21527.full.pdf
Some of the diagrams in it look remarkably similar to the paper under review and I see they reference it (No 4) on the latest paper
tonyb
This will hold up like Mann’s hurricane hockey stick and the Antarctic hockey stick: not at all.
His obsession seems rather pathological.
http://www.climatedepot.com/a/2768/Mann-at-it-again-Very-erroneous-conclusions-Michael-Manns-newest-invention-The-Hurricane-Hockey-Stick
http://www.globalwarmingskeptics.info/forums/thread-1111.html
This is off topic but I think deserves its own thread.
http://www.foxnews.com/politics/2011/06/22/nasa-scientist-accused-using-celeb-status-among-environmental-groups-to-enrich/
From down under: Tasmanian Sea Levels: The `Isle of the Dead’ Revisited by John L. Daly 2nd February 2003
NA Morner SEA LEVEL CHANGES IN BANGLADESH NEW OBSERVATIONAL FACTS
Contrast Kemp et al
Frankly that Mann gets his obsessions published on demand, while Lindzen and other skeptics get sent through the gauntlet is an indictment of the state of the so-called peer review process as anything.
The lousy lazy self-dealing that passes for peer review and permits a proven joker like Mann to continue to peddle garbage hockey sticks is worthy of a a forensic psychiatric profile on Mann, but has proven worthless regarding understanding the climate.
The faith community, as we see upthread, in trying to derail and dissemble and avoid the actual garbage article by Mann and pals is also notable.
The results Mann et al get for the period up to nearly 1000AD strike me as implausible.
Would the sea level ever remain exactly stable, (within a few centimetres) for 1000 years? I doubt any geologist would think so.
I suspect the methods, or the models they use, have the effect of supressing sea level change in the more distant past – (possibly the swamp sediments tend to compress over time for example).
Mann’s unique statistical methodology should not be questioned. Prior to the birth of Mann, Earth’s climate was as stable as a rock, despite regional fluctuations of course.
Does anyone think that scientists will eventually address the ordinary person’s experience of sea level rise? I ask because, once again, the theoretical claims made by Mann and others fly in the face of human experience. Mann claims a rise of 2 mm per year which would yield .2 m or 7.8 inches over 100 years. My mother has been alive for 95 years and is quite youthful. She is also quite familiar with the beaches on the East coast of the US. If there had been a sea level rise of 7.8 inches over that 100 years then the surf would be depositing foam 10 to 15 higher on the beach than it was 100 years ago. No such thing is taking place. In fact, the foam is right where it was in 1925. Why do scientists not address the fact that human experience of the ocean flatly contradicts their findings based upon research?
Permit me to anticipate the usual responses. Yes, I know about subsidence and uplift and all those cool things. So do scientists. So, why do scientists not take those matters into account when they report research from East coast US beaches that a gazillion of us are highly familiar with? If they know that ordinary observers cannot experience the rising sea level, why do they not explain to us why we cannot? Could we please drop the arrogance and report to the taxpayer?
In my humble opinion, Mann and crew have no explanation for the fact that ordinary people cannot observe the sea level rise. That means that their claims are falsified by ordinary experience.
Maybe climate scientists, at least the pro-AGW crowd, work under a curse. Maybe they are correct in their calculations of what sea level rise should be and of what ocean energy should be, but Mother Gaia just keeps changing things so that the calculations are never observed by normal humans. Maybe they need to get right with Mother Gaia.
“Why do scientists not address the fact that human experience of the ocean flatly contradicts their findings based upon research?”
These are not the kind of “scientists” which the term once described. There have been revisions. These are Ministry of Truth enablers. 1984 is their manual. Your point confirms that, once again.
Pardon the typo. A key clause should read:
the surf would be depositing foam 10 to 15 FEET higher on the beach than it was 100 years ago
I suppose two marsh sites is a more ‘robust’ data set than one tree.
I haven’t gone into this deeply, so maybe someone can explain to me why the sharp climb (hockey stick handle) in the graphs from the paper appears to start well before what is supposed to be the era of AGW — the second half of the 20th century. In the first part of the century, the increase appears to be smaller, but still the slope is unprecedented.
The graphs are so small that it’s hard to judge this, but it seems fishy to me.
Global warming is not thought to have started in the second half of the 20th century; it accelerated in the second half of the 20th century, and scientists were able for the first time to identify the signal of AGW in the data, and confirm experimentally the theories about global warming which had been around for two hundred years.
If you look at the CO2 data from 1958, you’ll find the level of CO2 was already 35ppm above pre-industrial levels, small compared to what we’ve done since, but not insignificant. Land-use changes and other forms of AGW started before 1950 too.
So why should it not be possible to “identify the signal of AGW in the data” before 1950 when the effect appears to be dramatic in this study?
Looking at the original hockey stick, I see that the same question applies. I just can’t remember having seen it asked. Something incredibly dramatic appears to happen around 1910-1920.
http://upload.wikimedia.org/wikipedia/en/e/ed/Hockey_stick_chart_ipcc_large.jpg
Dagfinn
Nothing dramatic happened. Dr Mann has his blade of the hockey stick upside down. I would estimate the bottom of the second phase of the LIA as being 1607. With numerous advances and reverses the trend has been upwards since then-not downwards until 1900 or so as his stick shows
The Giss records from 1880 were taken as the temperature turned down again from the warmer preceding decades which accentuates the subsequent ‘uptick’. Giss therefore tap into the latter part of the warmimg trend but do not identify the start of it over 200 years earlier.
I have a paper entitled ‘The long slow thaw’ in preparation that deals with this period, but then again I have several papers part way through the process including one entitled ‘Historic variations in sea level-Part 1’ which dreals with the period from the Holocene through to around 700Ad.
It clearly shows dramatic sea level rise-and fall- in contradiction to the study under reference in Judiths article.
tonyb
200 yrs ago was deep in the LIA. So yes, global warming has been going on ever since. Good thing. Nothing to do with human activity or CO2, however.
Robert
IPCC assumes all anthropogenic forcing factors beside CO (including land use changes, aerosols, other GHGs, etc.) essentially cancel one another out, so that the net radiative forcing for CO2 alone is roughly equal to the total anthropogenic forcing.
If one agrees with the IPCC model-based estimate of 2xCO2 climate sensitivity (with all feedbacks) of 3.2°C on average, we should have seen 0.5°C warming from 280 to 315 ppmv (when Mauna Loa measurements started in 1958) plus another 1.0°C from 1958 to today’s 390 ppmv, for a total anthropogenic warming of 1.5°C.
In actual fact we have only seen a bit less than half this amount of warming, so it appears that the 2xCO2 CS assumed by IPCC is exaggerated by >2:1 (if we assume that all warming was anthropogenic, as IPCC essentially does). If we assume that 50% of the observed warming can be attributed to the unusually high level of 20th century solar activity (per several solar studies) then the assumed 2xCO2 CS is high by ~4:1.
Using the model-based IPCC 2xCO2 CS of 3.2°C we should see an added 1.8°C warming from today’s 390 ppmv to an estimated 580 ppmv by 2100. At the observed 2xCO2 CS, the expect GH warming to year 2100 would be 0.4°C to 0.8°C.
That’s the order of magnitude range of GH warming we are talking about.
Max
Is PNAS peer-reviewed or pal-reviewed?
The latter.
When your using such a small sample size its problematic has it can be subject to a local issue which is not seen on a wider scale . In this case its clear there where local issue which the paper seem to deal with poorly .
So we back to the realm of ‘magic’ tress in trying to exporting a tiny amount of information with local and not well understood issues into global absolute. And your left with the impression that some people never learn from their mistakes . And that is before you get to the use Tiljander data which is problematic to say the least .
Judith,
The hilarity in this research is that evaporation and precipitation patterns are of no consequence to the region and the research that is pushing for a global pattern.
The two hemispheres are unique to each other in that one part is closer to the sun and further from the sun in orbital rotation which then would give some warning when the planet is cooling significantly.
Evaporation pattern have changed with the shifting of the ocean heat which when colder air generates much more evaporation then the regular warming and cooling trends.
I want more paper like this! And total media coverage. That might make people start checking the data from the real world.
Barrier shorelines are highly unstable: subject to tides, storms, waves, currents, sediment supply, drought, flood and compaction amongst other controls. It is possible to find a worse environment to measure sea level change. The Mediterranean for example, where tectonics dominate. But you really have to try.
Sea level reached the peak at the end of 2010. Now we go down.
http://sealevel.colorado.edu/content/global-mean-sea-level-time-series-seasonal-signals-retained
Willis wrote a great piece on this paper on WUWT. See http://wattsupwiththat.com/2011/06/23/reduce-your-co2-footprint-by-recycling-past-errors/
It seems the claim the reconstruction is validated by local tidal gauges is not exactly accurate because even the tidal gauges are not in close agreement.
When you add in all of the other criticisms of this Kemp/Mann paper, it is deja vu all over again with MBH98. It is hard for me to imagine that Michael Mann enjoys these kinds of public dunkings, but he must because he keeps coming back for more.
Lubos — “if one averages and smoothes the sea level and combines the noise in various proxies so that all the wiggles disappear, then all the wiggles disappear.”
Dr Curry
Thank you for posting on the Kemp paper.
My problem in this relates to what Steve pointed out at ClimateAudit on preferred treatment for the believers in PNAS and more importantly, after all that has been said about methods and data not being provided, why is this still the case?
Also, it was pointed out by a Ryan N. Maue as a comment on ClimateAudit that the Kemp paper was edited by Anny Cazenave who just happens to be the lead author of 5th Assessment Report (Sea Level Chapter). Will we see this over 2000 year sea level maximum rise in the AR5 report. No doubt we will.
The Kemp et al. 2011 PNAS report cited in the lead post by Judith Curry gives some interesting information on sea level off the North Carolina coast (but it does not show a “hockey stick”. .
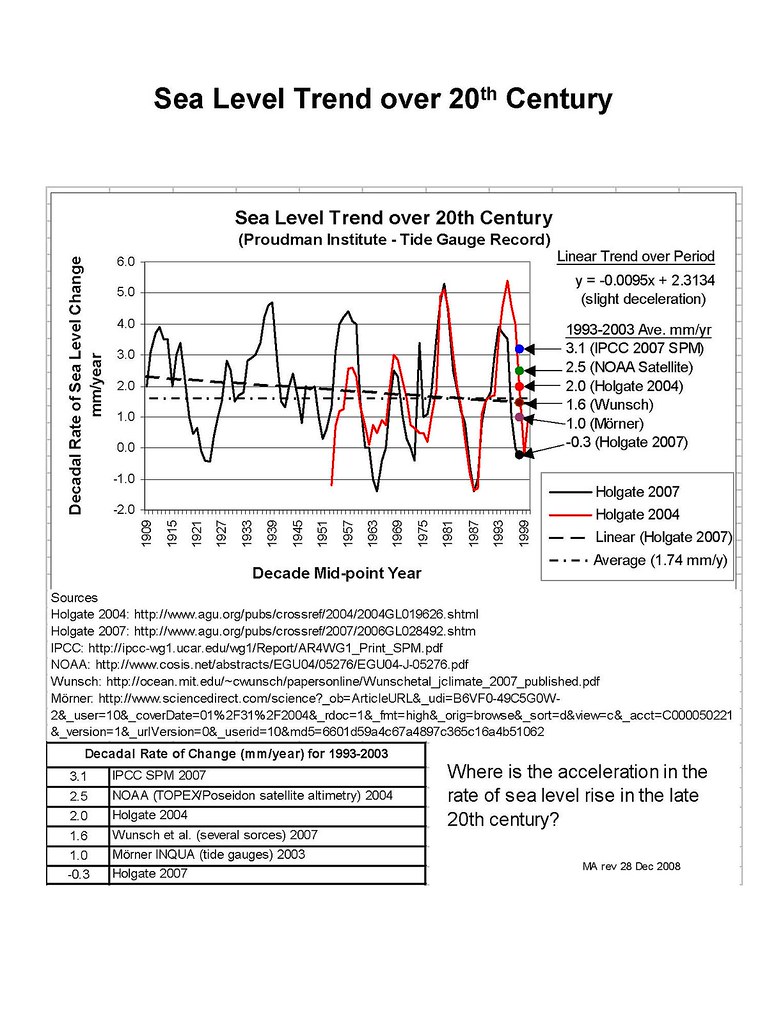
The 2.1 mm/y rate of rise observed in North Carolina since 1880 is a bit higher than the global rate of rise of 1.7 mm/y observed by Proudman (Holgate, 2007) over the 20th century. This deviation in sea-level rise from the global mean is stated by the study to likely be due to local ocean circulation changes.
All-in-all the report confirms Holgate 2007 (and Wunsch et al. 2007): Sea level rose by around 2.0 mm/y from 1904 to 1953 and by around 1.4 mm/y from 1954 to 2003, for an average of 1.7 mm/y over the 20th century. During this period there were strong decadal fluctuations in the rate (from net sinking of sea level to over 5 mm/y rise) and the most recent decade showed a rate of rise of 1.6 mm/y.
The tide gauge record shows that the rise is continuing at around this same average rate with continued strong decadal fluctuations. See attached graph of the Holgate data compared with various other data points for late 20th century rate of rise.
http://farm4.static.flickr.com/3206/3144596227_545227fbae_b.jpg
Based on sea level reconstructions since 1700, Jerjeva et al. 2008 showed that sea level rise started acceleration around 200 years ago.
http://www.psmsl.org/products/reconstructions/2008GL033611.pdf
The authors used a polynomial trend, but the same data can also be looked at using linear trends for the centuries. This would show an average net decrease in SL over the 18th century of –0.35 mm/y, an average increase in SL of +1.6 mm/y over the 19th century and 1.7 mm/y over the 20th century.
These data all seem to agree with the recent PNAS study.
Max
Again- Mann is clearly psycholoigcally obsessed with his hockey sticks.
Everyone of his other hockey sticks fails to stand up to critical review.
This one is, if anything, worse than the others.
it should be withdrawn from publication by the publisher.
The editor who chose to publish it was not doing a professional job, but was acting as a propagandist.
Judith Curry
Your last quote pretty much sums it up:
Max
I live on the east coast. Where I live the sea has been rising about 30 cm per century, however only 50 miles away the sea has been falling by roughly half that amount per century. Considering that the ocean is roughly level all over the earth, I think it is safe to conclude that it is the land which has been doing most of the moving up/down over the past century. It only appears to be the sea.
Did these scientists rule out changes in land relative to the adjoining sea? Is it even possible to rule it out over 21 centuries?
Sea level rise predictions from IPCC:
http://notrickszone.com/wp-content/uploads/2011/06/EIKE_7.gif
Are we allowed to extrapolate?
From the Journal of Coastal Research – 2008
“Modern Intertidal Foraminifera of the Outer Banks, North Carolina, U.S.A., and their Applicability for Sea-Level Studies”
“Furthermore, saltmarsh foraminiferal assemblages may be controlled by a number of variables (salinity, temperature, dissolved oxygen, etc.) that may have no direct relationship to elevation in the tidal frame….”
http://www.jcronline.org/doi/abs/10.2112/08A-0004.1?journalCode=coas
http://www.sas.upenn.edu/earth/bph/Res2008/Horton&Culver_2008.pdf
That MAY have no DIRECT relationship?
OK, but does that mean the reconstruct is wrong?
In the second study we find …
“The well-defined foraminiferal zones that
subdivide saltmarshes provide accurate indicators of former
sea level during the Holocene.”
No it does not mean it is definately wrong, but it does mean there is insufficent grounds to accept the conclusion as accurate
From the paper 2008 (pdf):
As Willis has pointed out:
Finally, is this possible?
M. carey | June 24, 2011 at 3:00 pm | Reply
…………………………..
“The well-defined foraminiferal zones that
subdivide saltmarshes provide accurate indicators of former
sea level during the Holocene.
———————–
Was the study based on “well-defined foraminiferal zones”?
Has the paper shown that all the other factors affecting foraminifera have remained unchanged for over 1,000 years? If it does not then one cannot accept the paper’s conclusions about the rate of sea level rise.
Sometimes there is a problem measuring the rate of sea level rise in one location?
Tropical Pacific Sea Level DROPPED From 1958 – 2007, New Study Shows
Jimbo – Did you cite the wrong article? The one you linked to focuses on the Indian Ocean, not the Pacific, and finds that sea level there dropped from 1960 to the mid-1990s, and then rose substantially – all of this while global mean sea level was rising. The article is about the cause of regional variations, based on changes in ocean currents and wind patterns.
Sorry, my bad. :(
Here is a global view.
http://www.jcronline.org/doi/abs/10.2112/JCOASTRES-D-10-00157.1
http://www.jcronline.org/doi/pdf/10.2112/JCOASTRES-D-10-00157.1
The British Admiralty charted the oceans of the world 200+ years ago in incredible detail, before the age of industrialization, before AGW. For obvious reason they made very detailed records of the tens of thousands of “drying rocks” around the globe. Those that are covered at high tide but revealed by low tide.
If sea levels were rising to any significant amount, these rocks would no longer be visible at low tide. However, that is not the case. They are still there for all to see at low tide.
Every chart has noted on it a correction for GPS (WGS84). Even reproductions of those charts made 250 years ago by William Bligh of Bounty fame have it added. Where are the correction noted for sea level change? Why a correction for GPS, but none for sea level rise?
Isn’t it strange that with all this talk about sea level rise, the actual records that people still use day to day based on actual observations hundreds of years ago, the records that are free of questionable proxies, these records are still as they were? If sea levels are rising, why isn’t every nautical chart on the planet showing a correction for this?
‘If sea levels are rising, why isn’t every nautical chart on the planet showing a correction for this?’
See…the evil tentacles of the well-funded Big Oil denier conspiracy to threaten and distort the honest work of poor downtrodden climatologists are everywhere.
Will nobody think of the children and Save the Planet?
No doubt all those rocks are still shown on the charts. I can’t see them erasing any rock from a chart just because it has decreased beyond being visible at low tide. A vessel can hit a rock covered by several feet of water at low tide.
By “significant amount” you mean _______.
“In Scotland, some areas were lifted by up to 60 centimeters during the last century, while parts of southern England and the French Channel coast sank by the same amount.”
So in other words, modeling CO2’s effects on sea level is inconsequential and a rat hole which we can stuff money in but if we sound the alarm and don’t tell everyone the whole story, maybe people will not take note and believe CO2 is the enemy.
According to the PNAS study N.C. sea level rose from AD 950 to 1400 because of Medieval warming and then became stable during the Little Ice Age.
Some critics of the study are suggesting that rather than the sea level rising and then stabilizing, it was N.C. coastal land falling and then stabilizing, coincidental to Medieval Warming and the Little Ice Age, and falsely giving the appearance of changing sea level. It seems like a weird coincidence, but anything can happen.
I guess a third possibility is a combination of rising sea level and falling land during Medieval Warming, followed by both being stable or changes in one offsetting changes in the other.
According to the Mann Hockey Stick, there is no Medieval Warming Period.
Why did it suddenly reappear?
Seems to me that the insigths provided by Willis Eschenbach in his article leaves the Kemp (Mann) paper dead in the dust.
http://wattsupwiththat.com/2011/06/23/reduce-your-co2-footprint-by-recycling-past-errors/
In addition to the orther crticisms of this paper, what is left?
So, are we going to see this obviously flawed paper as an important paper in AR5? You bet…
I don’t understand the relevancy of Eschenbach’s comments regarding sea level changes varying in Wilmington and Hampton Roads. Of course different places have different changes in sea level, but the authors of the study chose the marsh site in N.C. for specific reasons, one of which is it has had a rapid continuous sea level rise. For more on this see the comments at
http://www.realclimate.org/index.php/archives/2011/06/2000-years-of-sea-level/
I guess you are not trying to understand. The calibration against the gauges as used in the study seems to not hold up.
More importantly, the sites chosen in a river delta which is always rapidly changing, and where agricultural developments have been great over the last two hundred years, are likely influenced by a large number of more dominant factors than the global sea level changes etc. I recommend you read his article again.
You did not address the issue I raised, but anyway ….
Exactly what is meant by “seems” not to hold up”
Who said the characteristics of the site were determined entirely by changes in sea level?
How do you know other factors “likely” were more dominate than rises in sea level ?
M.carey –
I’ve been busy and haven’t managed to read Willis’ comments yet, but if his data is different from that presented by Kemp, keep in mind that their chosen site (I believe) is bracketed by Wilmington and Hampton Roads. I’ll let you take the next logical step – I’ll be busy for the next 48 hours.
M. carey,
There are more new problems highlighted in a new post just today.
http://wattsupwiththat.com/2011/06/26/further-problems-with-kemp-and-mann/
Do you think they took into account this 1886 earthquake?
http://earthquake.usgs.gov/earthquakes/states/events/1886_09_01.php
Or the 403 hurricanes/cyclones?
http://en.wikipedia.org/wiki/List_of_North_Carolina_hurricanes
I can’t think of a worse place or proxy to study the rate of sea level rise. I’m sure it exists, I just can’t think of it. ;)
Bruce I think you meant:
Largest Earthquake in North Carolina
Did you chek out the Isoseismal map? It easily encompasses the salt marshes.
http://earthquake.usgs.gov/earthquakes/states/events/1886_09_01_iso.php
The quake you reference is a II or III in the salt marsh. The SC quake was a V in the salt marsh.
http://en.wikipedia.org/wiki/Mercalli_intensity_scale
V. Rather Strong
Felt outside by most, may not be felt by some outside in non-favorable conditions. Dishes and windows may break and large bells will ring. Vibrations like large train passing close to house.
The New Madrid quakes where V as well.
http://earthquake.usgs.gov/earthquakes/states/events/1811-1812_iso.php
http://earthquake.usgs.gov/earthquakes/states/events/1811-1812_iso.php
“Newbern NC Feb 8, 1812 – Another earthquake – at 4 am yesterday a strong and alarming shock of an earthquake… its duration was perhaps two minutes; some think it continued much longer. The rocking, or rather jerking, was often repeated and violent. it seemed as if some monstrous weight had rolled or swing almost out of the power of the force which was restraining it; and that, that power by desperate tugs and efforts wrenched it back again. It went off with a trembling like the quivering of a vessel at sea after it had sustained a rugged stroke from an enormous and impetuous wave. A few minutes before 11 last evening another shock was felt by many, nearly equal in force and violence to that in the morning.”
http://www.showme.net/~fkeller/quake/lib/philanewspaper1.htm
At least the author’s have a real expert on constructing Hockey Stick charts. It is too bad there was not the follow up lawsuits against Mann which were contemplated. Left on his own, he searches for new hockey sticks. Fine with me, but please don’t publish them. He is tenured and can just pick the flowers.
Layman’s observation:
Only 20 or so miles east of the site of this study runs one of the world’s largest and most powerful ocean rivers, the Gulf Stream. It shapes everything in it’s path from Florida to Hatteras. I know the study authors have “adjusted” the sea level (land height) data for the GIA , but what about the the impact of the Gulf Stream on the area? Look at any nautical chart of the East Coast south of Cape Hatteras and you’ll see a note to the effect that navigational aids at harbor entrances are not shown because they need to be moved often due to frequent changes in the location and depth of sand bars. How anyone can be certain of where anything in this region was located, or how high (or low) it was relative to the sea level 1000 years ago is beyond me.
But what do I know…. I’m a sailor not a scientist.
Jim,
I’m just a layman, but my understanding is that in a salt marsh the layers of sediment containing the remains of foraminifera, very small plankton-like creatures, can be analyzed to reconstruct changes in sea levels in the long history of that particular location because different species of foraminifera live at different depths in oceans.
The researchers collected sediment samples from several(10?) salt marshes in the Albemarle-Pamlico estuarine system of North Carolina. Why would differences in sea level changes between the salt marsh area and Wilmington to the South and Hampton to the North have any bearing on the samples collected?
I think the study’s authors found a site in North Carolina
Strike my last sentence.
http://notrickszone.com/2011/06/23/leading-german-meteorologist-michael-manns-sea-level-story-a-quack/
M. carey
The wonderful thing about paleo reconstructions like this one is that by proper selection of the data set, careful interpretation of the reconstructed data plus a bit of statistical finagling one can prove exactly what one wants to prove. In addition, this study is weak to start off with, since it is limited to one location (as our host here has remarked).
A much better record of 19th and 20th century global sea level trends comes from the tide gauge records.
A good summary of the 20th century record can be found in Holgate 2007. In addition Wunsch et al. 2007 covered the period 1993-2003, for which IPCC claimed an acceleration over earlier periods.
Both Wunsch and Holgate found no such acceleration.
I think you can write off this SL hockeystick as just another “schtick”.
But, hey, if some people want to “believe” in it…(as P.T. Barnum said)
Max
Just curious, Max, can you name the scientists who were claiming sea-level-rise rate accelerated during the 100 years known as the 20th Century?
The IPCC said the SLR rate did not accelerate during the 20th Century.
JCH
Since you asked about IPCC claims of accelerated SL rise in late 20th century, let me quote from AR4 WG1 SPM (p.5)
Table SPM.1 shows this and adds a “fine print” footnote:
So we have IPCC telling us that the rate of SL rise was greater over a shorter time period toward the end of the century using one measurement methodology and measurement scope than it was over a longer time period that started earlier with a spliced record, three-fourths of which used a different measurement methodology and covered a different measurement scope.
OUCH!
This is supposed to be “science”?
Max.
This reconstruction tracks with long-term global tide gauge records very well. A comparison is shown in the paper.
Paul S
Let’s check that out, Paul.
The global tide gauge record (Holgate 2007) shows that SL rise over the first half of the 20th century averaged 2.0 mm/year and over the second half 1.4 mm/year for a total average of 1.7 mm/year.
Wunsch et al. 2007 confirm that the rate over the period 1993 to 2003 was around 1.6 mm/year (IPCC had claimed 3.1 mm/year, based on changing measurement methodology from tide gauges to satellite altimetry).
An earlier study (Unal + Ghil 1995) covering global SL over the time period 1807-1988 showed an average rate of rise of 1.62 mm/year over this period, so there was no statistically significant increase in the rate of rise in the 20th over the 19th century.
Take-home from all this is that the tide gauge record shows no recent acceleration of global SL rise.
Max
Max – Unal + Ghil, 1995 covers 93 years of the 19th century, and 88 years of the 20th Century, so the 1.62 miniature meters per year, when looking at other studies of the 19th Century years, is not representative of the 19th Century by itself and cannot be used for comparison between the 19th Century and the 20th Century.
manacker,
You suggest the researchers are crooked without providing any evidence.
Had different locations been studied would analysis of the sediment containing remains of foraminifera show sea level had not been rising at those locations over the past 2000 years? Anythings possible. More studies could be done to find out.
Do tide gauge records for the 19th and 20th Centuries conflict with the results of the study?
The record within the 20th Century isn’t relevant. See my 1:26 PM post for an explanation.
M.carey –
You suggest the researchers are crooked without providing any evidence.
I don’t think Max said “crooked” – but then I “could” be wrong. Id o, however, think he implied that they have a heavy “confirmation bias”. Which is true – and has been known for the last 13 years about at least one of the authors. It’s even possible that that particular author could be crooked. We may find out about that in the next years or so.
Whatever – the fact is that taking a single site and extrapolating it to the rest of the globe is patently and obviously deceptive, if not stupid. And that’s assuming that the sample is valid – which I would bet a plugged nickel on.
As for the 20th C being irrelevant – I’ll look at your explanation – but I don’t think so.
would bet a plugged nickel on.
should be –
would NOT bet a plugged nickel on.
You KNOW the findings of the study do apply to the world in general or you SUSPECT these findings may not apply?
M. carey
You ask:
See my response to the same question by Paul S.
The global tide gauge SL record shows no acceleration in rate of rise.
Max
Max – I don’t agree. This study does not show an acceleration of the rate of sea level rise between the first half of the 20th Century and the 2nd half of the 20th Century, which makes this study consistent with Simon Holgate and the IPCC and everybody else I have read. Holgate has said the rate in the first half was insignificantly higher.
What the study finds is the rate of sea level rise in the 20th Century is greater than the rate of sea level rise for any Century in the prior 2,000 years: 19th Century on back.
Why no acceleration in the last 80 years?
And from the IPCC:
M carey
Look, M. carey. A paleo reconstruction study covering the North Carolina coast shows one thing.
Multiple independent studies using the long-term global tide gauge record shows something else.
Nobody is necessarily “crooked” here (nor have I implied so). It’s just that the NC study doesn’t mean too much in the overall scheme of things, that’s all.
Max
Couple all this with man-made sea level rise by other means. ;)
Seems to me this partuial comment and response from RC says an enormous amount about where the whole sorry mess that passes for reasoned debate has come to :
=============================================
The study has also been criticised on various blogs for using [edit] Tiljander lakebed sediment data series [edit]
I don’t claim to understand the objection but given that it has spread like wildfire on blogs I am surprised that no one has mentioned it here.
Is this objection valid?
[Response: No. Just more of the usual deception from dishonest mud-slingers. More on that in short order. -Mike]
==============================================
For heaven’s sake! Snip, then ad hom.
Or one might say the moderator answered the question and promised to deal with the subject more fully in the fullness of time.
Concerning the RC article, there is an update addressing Alex Harvey’s question.
Or that the Chief Suspect said he didn’t do it and that he will have a full story straight ‘sometime in the future’. And hopes that the feds will go away.
Did it work for Bernie?
He Has Spoken!
Believers now know The Truth. From His Own Lips, He has Cast His Knowledge among you, Verily ye are Blessed to be alive when the Great Scientist moves among us in Human Form. And Guides and Leads ye in the Path Of True Understanding.
Blessed are the Warmists!
The critiques from Jens Schröter and Mojib Latif seem reasonable though the part about glacial rebound was confusing. As far as I can tell the study explicitly corrects for that. Trying to find further suitable sites for this kind of study in other parts of the world would be a good next step for confirmation.
——————————-
‘After looking at all this, I have a hard time finding much empirical rationale for a relationship between global average surface temperature and global sea level that makes sense over the range of sea level for the past several thousand years.’
I don’t understand this statement in the context of the paper. It doesn’t simply assert a relationship; it uses an independent sea-level reconstruction, global temperature reconstruction and simple temperature-sea level model to test the validity of the relationship. It finds a surprisingly strong agreement over the past thousand years. Before that there is a large divergence but they suggest the most likely reason is that the temperature reconstruction is wrong. That’s right people: the paper says Mann’s reconstruction is wrong (Before 1100AD)!
It might be a statistical fluke so further data collection would be beneficial but at present I can’t see any empirical rationale for rejecting a reasonably straightforward relationship between temperature and sea level over at least the past thousand years.
As far as prediction goes it would obviously be shaky to rely on this simple empirical study on its own. The problem with looking at the past two thousand years for clues is that we are heading into a near future that will be quite alien to that period. The past may not be an indicator of future results but we don’t have much else to work with.
Isn’t it generally regarded as poor methodology to splice signals due to the bandpass problem?
For example, take any noisy signal. Apply a low bandpass filter to the first portion of the signal and a high bandpass filter to the end portion. What you will end up with is a signal that looks quite flat in the first portion and quite spiky in the end portion.
Looking at the resulting signal you might then incorrectly conclude that the object generating the signal had changed, while in fact the observed change is simply an artifact of the bandpass problem.
Since it is unlikely that a tidal gauge has the same bandpass as ocean sediments, it would appear that any conclusions drawn from the signal might simply be an artifact of the signal processing. Unless and until the same bandpass filters are applied to both portions of the signal you cannot reliably splice the signals and achieve a significant result.
For example, it is likely that the ocean sediments are a low bandpass filter. There may well have been spikes in the low bandpass section of the signal similar to what is observed in the tidal gauge. However, these would no longer be visible due to the effects of the filter. Thus, it cannot be ruled out that such spikes are typical of the signal.
I’m not following what your point is here. As far as I’m aware this paper doesn’t splice any signals. It’s all based on measurements of Foraminifera in salt marsh sediments.
edward,
Klaus-Eckart Puls concludes the sea level rise of the 20th Century can’t be the steepest century scale increase of the past 2000 years as the reconstruct shows, because several studies show no acceleration of the rise in sea level during the 20th Century. His logic is faulty. A 20th Century rising trend with no acceleration can show a sharper rate of increase than slower rising 19th Century trend
M.carey –
You need to figure out the difference between “sea level rise” and “acceleration of sea level rise”, Your last sentence, as written, is nonsense. Try it again.
The sentence makes perfect sense, but I will try to explain it with a hypothetical example:
20th Century rate of increase = constant 2% each year
19th Century rate of increase = constant 1% each year
Within the 20th Century there is no acceleration in the rate of increase, but the rate of increase is faster than the rate of increase in the 19th Century, so obviously the rate has accelerated from one century to the next.
M Cary– LOL double check your sources of information- the rates of increase were not and never will be 1% or 2% per year…..unless you believe the ocean doubles in size over 50 to 100 years
Good Heaven’s, Rob, find out what ‘hypothetical” means.
I should have used 10% and 20% for my hypothetical example. That would have really got you going.
it would have been easy to adjust to a 10% to 20% change per year—all land based life ends on earth in year 1
I think you probably mean 1mm or 2mm per year, but don’t let data get in the way of your belief system
And how would you get from your hypothetical 1% per year rate to your hypothetical 2% per year rate without a hypothetical 1% per year per century acceleration?
A hypothetical 1% rate of increase in the 19th Century followed by a hypothetical 2% rate of increase in the 20th Century is an increase in the rate of increase because 2 is greater than 1.
You;re losing it.
Either give up the joint, or give up blogging. Blogging while stoned is not good for your reputation.
An instantaneous change from 1% to 2% on the stroke of midnight 31 Dec 1900? I wonder what could cause that?
And this from the guy who accused me of cheating and cherry picking and has failed to apologise?
(I assume you don’t mean 2%..but some other unit. Let it be a typo lest you be even further embarassed)
No, I mean 2%, but that’s an average annual growth rate, and doesn’t mean it jumped from 1% at 11:59 PM on Dec. 31, 1899 to 2% at 12:00 AM on Jan. 1, 1900. It sounds like you are interested in growth rate per minute or second.
The sentence makes perfect sense, but I will try to explain it with a hypothetical example:
Hold on there Carey! Are you so naive you believe your audience actually understands what big words like “hypothetical” mean?
HA HA, you must be pretty dumb to believe that.
I feel sorry for Mann. He had to poke around in marshes all over the East Coast to find just those sites consistent with his confirmation bias. And look what happened. All he got was a hockey stick slightly different than the one he started with. All that hard work for nothing.
I have been in some of those marshes. There are snakes and all kinds of biting insects. The horse flies bites are downright painful. Give these researchers some credit for their fortitude.
I’m more inclined to give local flora and fauna a medal.
Michael Mann is not in the photographs. Maybe he never went to North Carolina. He is not the lead author.
He just supplied the hockey sticks. I hope they weren’t the ones with the lead paint on them.
Mann, at most, sent an underling to the swamps.
The typical principal researcher would turn the project over to a post-doc, who advised a doctorate student, who told a grad student, who commanded an undergrad intern, to actually do something.
More likely, none of his gang got close the swamps, and simply ‘processed’
the data to fit his long existing hockey sticks.
Principal researchers like Mann seldom actually get their hands dirty.
Despite disinformation elsewhere Mann has no affiliation with the lead authors. They are all from different Universities.
Mann played no part in the reconstruction. From what I can tell he’s blagged a co-author credit by making a few minor adjustments to his 2008 temperature reconstruction when testing the temperature – sea-level relationship.
OK, children.
We have beaten this dog to death with insinuations that someone called the NC SL team “crooked” and all sorts of other senseless sidetracks.
Facts:
The cited NC paleo reconstruction concludes that 20th century rate of SL rise was unusual in 2000 years.
Numerous independent global tide gauge records tell us a) that there has been no acceleration in rate of global SL rise over the 20th century, b) that there has been no acceleration in rate of global SL rise over the last decade of the 20th century compared to earlier longer periods and c) that there has been no acceleration in rate of global SL rise in the 20th century compared to the 19th century.
Different studies + different scopes of measurement + different methodologies = different results.
Can we all agree on this and finally bury this dead dog?
Max
‘that there has been no acceleration in rate of global SL rise in the 20th century compared to the 19th century.’
There aren’t many tidal gauge studies going back that far and I haven’t heard one that shows this. Do you have a reference?
The commonly referenced paper I’ve seen is Jevrejeva et al 2008: http://www.psmsl.org/products/reconstructions/jevrejevaetal2008.php. It shows a 6cm rise over the nineteenth century compared to 19cm in the twentieth century.
‘that there has been no acceleration in rate of global SL rise in the 20th century compared to the 19th century.’
Tonyb, put this one to Simon Holgate. Double dare.
Simulations of the last 500 yr carried out using the Third Hadley Centre Coupled Ocean–Atmosphere GCM (HadCM3) with anthropogenic and natural (solar and volcanic) forcings have been analyzed. Global-mean surface temperature change during the twentieth century is well reproduced. Simulated contributions to global-mean sea level rise during recent decades due to thermal expansion (the largest term) and to mass loss from glaciers and ice caps agree within uncertainties with observational estimates of these terms, but their sum falls short of the observed rate of sea level rise. This discrepancy has been discussed by previous authors; a completely satisfactory explanation of twentieth-century sea level rise is lacking. The model suggests that the apparent onset of sea level rise and glacier retreat during the first part of the nineteenth century was due to natural forcing. The rate of sea level rise was larger during the twentieth century than during the previous centuries because of anthropogenic forcing, but decreasing natural forcing during the second half of the twentieth century tended to offset the anthropogenic acceleration in the rate. Volcanic eruptions cause rapid falls in sea level, followed by recovery over several decades. The model shows substantially less decadal variability in sea level and its thermal expansion component than twentieth-century observations indicate, either because it does not generate sufficient ocean internal variability, or because the observational analyses overestimate the variability. …-Gregory et al, 2006
1. Did global sea level rise start centuries ago?
Global sea level rise, an important consequence of climate change, will likely affect the lifestyles of people living in coastal communities. Yet controversy and uncertainty cloud discussion of how fast sea level is rising, and why. To learn more, Jevrejeva et al. are the first to reconstruct global sea level since 1700 using tide gauge records from around the world. The authors then analyze the evolution of sea level changes for the past 300 years and present observational evidence that recent global sea level acceleration may have started at the end of the eighteenth century. They also find that sea level rose by 6 centimeters (2.4 inches) during the nineteenth century and 19 cm (7.5 in) during the twentieth century. If the conditions that established the acceleration continue, sea level will rise 34 cm (13 in) over the 21st century. The authors conclude that sea level acceleration will depend on the actual rate of temperature increase in the 21st century and that the latest Intergovernmental Panel on Climate Change estimates of sea level rise for the 21st century are probably too low. – Jevrejeva S, Moore JC, Grinsted A, Woodworth PL (2008)
“Our analyses do not indicate acceleration in sea level in U.S. tide gauge records during the 20th century. Instead, for each time period we consider, the records show small decelerations that are consistent with a number of earlier studies of worldwide-gauge records. The decelerations that we obtain are opposite in sign and one to two orders of magnitude less than the +0.07 to +0.28 mm/y2 accelerations that are required to reach sea levels predicted for 2100 by Vermeer and Rahmsdorf (2009), Jevrejeva, Moore, and Grinsted (2010), and Grinsted, Moore, and Jevrejeva (2010). Bindoff et al. (2007) note an increase in worldwide temperature from 1906 to 2005 of 0.74uC.
It is essential that investigations continue to address why this worldwide-temperature increase has not produced acceleration of global sea level over the past 100 years, and indeed why global sea level has possibly decelerated for at least the last 80 years.”
http://wattsupwiththat.com/2011/03/28/bombshell-conclusion-new-peer-reviewed-analysis-worldwide-temperature-increase-has-not-produced-acceleration-of-global-sea-level-over-the-past-100-years/
Not C
Not C
Translation.
Paul S
I have already referenced the study (Unal + Ghil 1995) covering global SL over the time period 1807-1988, which showed an average rate of rise of 1.62 mm/year over this period.
This compares with (Holgate 2007) 1.74 mm/year average over the 20th century. IOW these studies show that there was no statistically significant increase in the rate of rise in the 20th over the 19th century. [In addition, the second half of the 20th century showed a slightly lower rate of SL rise (~1.4 mm/year) than the first half (~2.0 mm/year), as mentioned earlier.]
The study you cite (Jerjeva et al.2008) takes the record back to 1700.
http://www.psmsl.org/products/reconstructions/2008GL033611.pdf
The authors apply a polynomial trend line to the data to show an apparent steady acceleration of 0.01 mm/yr2 in the rate of SL rise over the three centuries.
Another statistical approach to analyze the raw data is to determine the linear rate of SL rise for each of the three centuries, to see if there has been a statistically significant change in this rate between the centuries.
Using this approach the data show that there was a net reduction in SL over the 18th century of –35 mm, a SL rise of 150 mm over the 19th century (close to the Unal + Ghil data) and a further rise of 170 mm over the 20th century (close to the Holgate data).
http://farm4.static.flickr.com/3165/5869123718_c1c0307c25_b.jpg
This shift in SL trends coincides roughly with a shift from the cooling trend over the 18th century (around -0.3°C from 1701 to 1800) as evidenced in the CET record, to a gradual warming trend that commenced in the 19th century and has continued to today (at around +0.4°C per century), implying a temperature/SL causation (?) that would appear to make sense.
Max
I just ran the same linear test as was supposedly done for your linked graphic. I ran linear trends from 1700-1800, 1800-1900 and 1900-2000 as suggested and got -6mm, +95mm and +190mm respectively.
I can see on your linked graphic that the 1800-1900 trend line simply doesn’t fit the data so I don’t think it is an accurate analysis.
Please download the data from http://www.psmsl.org/products/reconstructions/jevrejevaetal2008.php and report back with your own findings.
Also, the CET record does show an approximate +0.4C/century increase from 1800 but the trend from 1800-1900 is close to zero. The positive trend is almost entirely attributable to the twentieth century.
Data is here: http://www.metoffice.gov.uk/hadobs/hadcet/data/download.html
Paul S
Will come back to you on SL numbers, but the 0.04C per decade temperature increase from 1850 to today is the underlying linear warming trend observed over the entire HadCRUT record (not CET) from1850 to 2010. There were two statistically indistinguishable 30-year warming cycles (one in the early 20th century and one in the late 20th century) and a third slightly less pronounced 30-year warming cycle in the late 19th century. In between there were ~30-year cycles of slight cooling.
The CET record had several such warming cycles, most notably the one from 1695-1725 and the latest one from 1976-2005, which are also indistinguishable from one another. Others are less pronounced.
Max
Again, your figures check out for the overall decadal trend between 1850 and 2010 in HadCRUT but you seem to be arguing that this has been a reasonably consistent feature over the whole period, which is unsupportable.
I’ve made some plots of the HadCRUT data (Link: http://imageshack.us/photo/my-images/847/hadcruttimecomp.gif/).
The top line shows the series split down the middle, 80 years each side. You can see the trend is actually negative for the first half.
The lower line shows the best case cherry-picks for your agument, but still the difference is clear.
——————————————–
Also, here’s the linear trend sea-level plots from the Jevrejeva 2008 data: http://imageshack.us/photo/my-images/27/jevrejeva2008timecomp.gif/
The series overlap to make it easier to see where trends develop. You should be able to see from this that twentieth century sea level rise is considerably greater than that seen in the nineteenth century. If you were to modify your argument to say that sea level rise has been relatively consistent from about 1860 to today you would have a case.
Paul S
Believe you have misunderstood my statement on the HadCRUT record.
I simply stated that the overall record 1850-2010 shows a linear warming trend of 0.04C per decade, but the warming occurred in two statistically indistinguishable 30-year warming cycles (early and late 20th C) plus a 30-year warming cycle in the late 19th C with slightly less warming. In between these warming cycles were 30-year cycles of slight cooling.
As Girma has shown here, this resembles a sine curve with an amplitude of +/- 0.2C and an overall cycle time of 60 years on a tilted axis with a slope of 0.04C per decade.
The CET record also has multi-decadal warming cycles, which are less prominent; the two most prominent cycles are in the early 18th century and the late 20th century.
Now to the Jerjeva et al. data
Your plots look OK. I re-plotted them myself into 50-year periods, as you did. My earlier plots were in error. The two periods with the most rapid rate of warming were 1851-1900 (1.59 mm/year) and 1951-2000 (1.57 mm/year). The 20th century series look a bit different from Holgate 2007, in that Jereva show more SL rise in the second half than in the first (1.57 mm/year vs. 1.29 mm/year), while Holgate shows more rise in the first half (2.0 mm/year vs. 1.4 mm/year).
The 19th century Jerjeva figures do not check with Unal + Ghil, which showed an average rate of rise of 1.62 mm/year over the time period 1807-1988.
All in all it looks like there are a lot of data out there, which do not correlate too well, but there does appear to have been more rise in the 20th than in the 19th century (due to the fairly flat period 1801-1850), but the two 50-year periods with the highest rate of rise were 1851-1900 and 1951-2000.
Since 1850 it has warmed at about 1.6 mm/year on average, with a lot of multi-decadal fluctuation, but no significant visible trend of acceleration.
Max
Paul M
Last sentence should read
Since 1850 it has risen at about 1.6 mm/year…
Paul M
I’ll accept your statement:
Max
It’s good to compromise. This will seem churlish now but I’ve realised your point b is also technically wrong. By every measure I’ve seen sea level rise in the 90s was significantly greater than the long-term average but, as IPCC AR4 SPM states, whether this ‘reflects decadal variability or an increase in the longer-term trend is unclear.’
The satellite altimeter data is still showing an above average 3.1mm/yr from 1993 to the present. From 2004 to the present the rate is lower at about 2.1mm/yr.
Paul S
Do we know how much of this has come from changing the method and scope of measurement in 1993?
Wunsch et al. 2007 reported 1.6 mm/year for the period 1993-2003 while IPCC reported 3.1 mm/year for the same period by switching from tide gauges to satellite altimetry in 1993.
So from this I would conclude that 1.5 mm/year could well come from the change of method and scope of measurement.
Max
PS But I would agree to the IPCC “caveat” about large decadal variability – all one has to do is look at the tide gauge record to confirm this:
http://farm4.static.flickr.com/3206/3144596227_545227fbae_b.jpg
Actually the satellite data from 1993-2003 agrees well with most tidal gauge records. Church & White 2006 found a 3mm/yr average for the period. Jevrejeva et al. 2008 shows about 3.4mm/yr from 1992-2002 (2002 being the last year in the record) and 3.6mm/yr between 1993 and 2002. Holgate 2004 found a rate near 4mm/yr for the 90s (though only going up to 1998 I believe).
I don’t know of any published papers showing tidal gauge records beyond 2004 so an up-to-date comparison with satellite data is difficult.
The Wunsch 2007 figure is an estimate derived from a modelling exercise, not a measurement. They think the discrepancy between their result and the satellite data could be mostly due to the introduction of freshwater from melting sea ice. Freshwater is less dense than sea water so will raise sea level.
Paul S
I have already referenced the study (Unal + Ghil 1995) covering global SL over the time period 1807-1988, which showed an average rate of rise of 1.62 mm/year over this period.
This compares with (Holgate 2007) 1.74 mm/year average over the 20th century, so there was no statistically significant increase in the rate of rise in the 20th over the 19th century.
The study you cite (Jerjeva et al.2008) takes the record back to 1700.
http://www.psmsl.org/products/reconstructions/2008GL033611.pdf
The authors then apply a polynomial trend line
Paul S
Please delete my second post above – it is a partial repeat of the first complete post.
Max
Did anyone notice this did not have traditional peer review? It had a pre-arranged reviewer who says she “edited” it? See her listing and footnote under the author listing.
Very strange, I have never seen this before.
Paul S
So your answer to my question below about the observed discrepancy between satellite versus tide gauge readings:
Is essentially:
No. We do not know. We don’t even think there is much of a discrepancy.
It would be an amazing coincidence if two totally different methods which measure two totally different scopes of measurement came up with the same figure in a record that is fraught with major measurement problems and large decadal swings (the record I have cited shows that, indeed, they do not).
But let’s leave it that it was simply “bad science” for IPCC to compare a record based on tide gauges covering one scope of measurement over one time period with another based on satellite altimetry covering a different scope of measurement over a different time period in order to imply an acceleration between the two time periods.
And back to the original topic, this new NC study does not really give us much new info on global SL trends because of its local scope; furthermore, it appears that it is already being critiqued and refuted. Whether it can withstand these attempts or dies the same death as the hockey stick remains to be seen.
But I think we can wind up our discussion on global SL.
Max
Since there is no discrepancy the answer is obviously a simple ‘zero’. Global SLR between 1993 and 2003 was greater than the long term average whether you use tidal gauge or satellite measurements.
There are of course big challenges with collating tidal gauge and satellite measurements into global records but this challenge has been faced by numerous studies now and the results have proved robust to differences in methodology. There are large decadal swings in the rate of sea level change but that is actually part of the signal rather than an artifact of the measurement system, which is why the satellite records are picking it up in tandem.
The acceleration over the time period was also seen in both referenced tidal gauge records in the IPCC report so there would be no reason to switch measurement system in order to imply acceleration. I’m not sure why you’re finding this so difficult to accept. Both in the IPCC report and in our discussion it is noted that ‘accelerations’ of similar magnitude have been observed at other points in the last 150 years so it’s not even the case that you would be accepting a systematic recent increase in SLR.
An excellent rebuttal of this paper by Willis Eschenbach at WUWT
http://wattsupwiththat.com/2011/06/26/further-problems-with-kemp-and-mann/#more-42276
Paul S
It is very clear to me that tide gauge records showed a significantly lower rate of rise over the IPCC “poster period” of 1993-2003 than the satellite altimetry record cited by IPCC..
Of course you are correct that even if there feally had been a higher rate of rise over this decade this proves nothing about trends:
That is plain to see from the record. Four decades since 1900 show a higher average annual rate than the IPCC satellite estimate for the decade 1993-2003 (see Holgate 2007 data I posted):
1907-1916: 4.0 mm/year
1935-1944: 4.7 mm/year
1953-1962: 4.4 mm.year
1975-1984: 5.3 mm/year
As far as the NC study by Kemp et al., believe Venter his cited a first rebuttal (others may follow) – but this is irrelevant to our discussion.
And I do believe we have discussed this topic to death.
Max
It may have been done to death but I still don’t see the basis for your position. You say ‘It is very clear to me that tide gauge records showed a significantly lower rate of rise over the IPCC “poster period” of 1993-2003 than the satellite altimetry record cited by IPCC’ but the source of this clarity is unclear. I’ve cited three tidal gauge records which show similar or higher SLR compared to the satellite data around the 1993-2003 period (two of the records only go up to 2002). Two of these records were cited alongside the satellite data in the IPCC report.
You’ve cited Wunsch 2007 to support your argument but, as I’ve noted, that paper is about a GCM modelling exercise, not tidal gauge measurements.
Paul S
You appear still to not understand what I am writing.
Check Holgate 2007 (LT SL record from tide gauges), not Wunsch 2007 (data from various sources).
My beef:
IPCC suggests an acceleration in SL rise toward end of 20th C by comparing a longer term record spliced from tide gauges and a satellite altimetry tail with a later shorter term satellite altimetry record. This is bogus science (comparing different methods/scope/length of time periods to suggest an acceleration)..
IPCC adds the caveat about “decadal variability”, but fails to mention that this decadal variability was many times greater than the suggested acceleration itself. This is also bogus science (by omission).
Had IPCC stuck with the same measurement methodology/scope for the longer-term/shorter-term comparison and pointed out that, due to the large decadal swings it is clear that shorter time periods can show higher averages than longer ones, this would have been good science.
But I am afraid IPCC was more interested in selling the story of late 20th century acceleration in rate of SL rise than in presenting “good science”.
Do you understand my problem with the IPCC presentation on SL now?
It should be fairly clear to see.
Max
You appear to want to focus the discussion on published numbers in IPCC AR4 in which case Holgate 2007 is irrelevant since it didn’t meet the publishing deadline for inclusion. They had two contemporary global tide gauge records to work with, both showing similar results to the satellite altimetry data.
But let’s imagine a hypothetical where Holgate 2007 was available for consideration. Could it and should it have changed the IPCC position on the data?
Holgate 2004 looked at tide gauge records from around the world and picked out those which met criteria for being reasonably well kept and updated back to the middle of the twentieth century. They found 177 stations that fit the bill.
Holgate 2007 used similar criteria for data quality but extended their view back to the beginning of the twentieth century. This time only 9 stations could be used.
So if you’re comparing Holgate 2004 and 2007 graphs after 1950 realise that one has been produced by reference to 177 independent stations and the other only 9, then adjust your confidence in each accordingly. I’ve emailed Dr. Holgate for his view on this issue but he’s away so I won’t get a reply for a couple of weeks.
If the satellite alimetry data was significantly different to the global tide gauge records between 1993 and 2003 you would have a case concerning the comparison of datasets but the evidence suggests otherwise.
The problem with splicing on altimetetry readings to tide gauge readings is that it hides the decline that everyone familiar with tide gauge records know is coming. They do not measure the same thing and can not be spliced.
There was no splicing. There was comparison of datasets with different approaches to measuring the same phenomenon: multiple lines of evidence.
Why do you suppose the satellite data won’t show similar SLR variability to the tide gauge records? It seems to be well-established at this point that such variability is a real phenomenon rather than an artifact of data collection methodology.
I have an update on a previous post. I’ve found this paper (Church & White 2011): http://www.springerlink.com/content/h2575k28311g5146/fulltext.pdf. It updates the tide gauge record to 2009 from the previous global analysis. They find 2.8 ± 0.8 mm/yr SLR in the tide gauge record between 1993-2009 compared to 3.2 ± 0.4 mm/yr from the satellite altimetry data over the same period.
I have a story, it isn’t a true story, but a good one none the less.
For 15 years I sold fertilzer X. In order to show the effectiveness of fertilizer X I measured the tree I fertilized with it to the top of a tree I didn’t fertilize. Lets call the tree fertilized sea level and the other tree land under the influence of isostatic movement. The last 5 years I sold ACME fertilizer. I changed how I measured the growth of my tree and now compare it with the ground. Lets call the ground the center of the earth.
Imagine my suprise when my ACME fertilizer worked so much better then the fertilizer X did. Anyone trying to sell sea level rise acceleration by comparing tide gauge records to atlimetry reading is selling ACME fertilizer.
The proper analogy would retain fertilizer X throughout and simply change the method of measurement.
So stay with tide gauges and don’t switch to satellites – there’s no appreciable difference in the results.
There is no difference and yet you have papers such as this one:
http://www.agu.org/pubs/crossref/2010/2009JC005630.shtml
which states:
“The global mean sea level for the period January 1900 to December 2006 is estimated to rise at a rate of 1.56 ± 0.25 mm/yr which is reasonably consistent with earlier estimates, but we do not find significant acceleration.”
This is actually somewhat amazing considering the retention of surface water has been decreasing and the use of groundwater has been increasing which by itself should be a significant cause of accelerating sea level rise:
Actually I like my analogy. Lets call it fertilizer with and without co2.
The tide gauge data from the paper I linked shows 1.6mm/yr average increase between 1900-2006. However it still shows a 2.8mm increase between 1993-2009, which is what we’ve been talking about.
Does the Wenzel/Schröter paper have data available to calculate recent changes?
Sorry, I’m too cheap to buy papers. You’d have to find someone with access to the full paper to maybe get the data there. I think you fail to account for the fact that it doesn’t matter if the sea level rise is 2.8mm. What matters is that the SLR as measured by tide gauges is showing no different behavior then it has in the past. If you really want to make conclusions based on tide gauge data then deceleration would be an appropriate term.
On that note check out Figure 6 in the paper I linked for a comparison between various global tide gauge records and satellite data.
I glanced at the paper. Isn’t Church the same one that corrected the “noise” in tide gauges records using altimetry readings in an earlier paper? If so that causes me some hesitation to take anything he does too seriously. Wish I could remember the paper now. I read too much and save too little.
A quick reading of the Wenzel paper you cited (found a link: http://epic.awi.de/Publications/Wen2010a.pdf) says they trained their data using the altimetry record
Church & White are performing global reconstructions, meaning they are trying to represent the whole ocean area rather than simply the coasts. They looked at the satellite data and found relationships between open ocean areas and coastal tide gauge readings. They used these established relationships to reconstruct the global picture using only tide gauge readings. In this paper – ftp://soest.hawaii.edu/coastal/Climate%20Articles/Cazenave%20coastal%20sea%20level%20and%20altimetry%202009.pdf – you can see that open ocean is generally much less variable than the coasts so including them will inevitably reduce “noise”.
From a brief reading it seems Wenzel is using a similar approach.
GRACE is used for measuring ocean mass. It is a separate entity from the altimeter satellites.
Oops, wrong reply line. This is getting confusing.
GRACE is used for measuring ocean mass. It is a separate entity from the altimeter satellites.
The paper I am refering to didn’t eliminate the noise from the data sets only where satellite data was available. They went back in time and used it to adjust data from before the satellite era. How they accomplished this is a mystery to me. Also, after reading the following paper one has to wonder what data set should be used to adjust which:
http://onlinelibrary.wiley.com/doi/10.1111/j.1365-246X.2010.04508.x/abstract
wrt to Quinn 2010, it is cited by this article:
Satellite altimetry allows precise measurement of present-day global mean sea level change (e.g., Cazenave and Llovel, 2010). When combined with the GRACE ocean mass rate, the steric component of sea level change (effects of vertically-integrated sea water temper- ature and salinity changes) can be deduced (e.g., Chambers et al., 2004; Chambers, 2006; Lombard et al., 2007; Llovel et al., 2010b). In principle, this is possible because satellite altimetry measures the sum of thermal expansion and ocean mass change, while GRACE measures the ocean mass change only. As in situ ocean temperature and salinity measurements (e.g., from the Argo profiling floats) are limited to the upper oceans (above 1000–2000 m), the altimetry-GRACE estimate combined with in situ data should provide information on the deep ocean contribution to sea level, and related changes in heat storage. However current uncertainties in Argo-based steric sea level (e.g., Lyman et al., 2010) and GRACE-based ocean mass change (Quinn and Ponte, 2010) still prevent from constraining the deep ocean contribution.
And if you can’t tell how much is water and how much is a change in the shape of the ocean floor what meaning does it have?
That’s possibly a reasonable point but it also applies to tide gauge data. Since we were discussing the difference (or not) between tide gauges and altimetry satellites it’s a bit of a tangent.
If you are measuring from the center of the earth and you are not sure what the ocean floor is doing you are guessing at any comparison to tide gauge data. Tide gauge data doesn’t need to be guessed at since it has been recorded for a long time. It isn’t the actual sea level rise that is important, it is any change in that rise that we are interested in. Basically I go back to my fertilizer comparison. You just can’t do it.
Great. I’ll return you to my previous comment:
So stay with tide gauges and don’t switch to satellites – there’s no appreciable difference in the results.
You mean besides the fact that the tide gauges show no acceleration in sea level rise and if you don’t draw a dark black line on your graph as the IPCC did you start to see a decline in the sea level rise just as there has always been previously? Well, besides the fact that there has been no change in the behavior of sea levels and no sign of a sea level rise acceleration unless you combine two measurement techniques that don’t measure the same thing I guess you are right.
Tide gauge records show no significant acceleration over the twentieth century but that doesn’t mean current SLR can’t be above the long-term average. Both global tide gauge and satellite data show that current (1993-2009) SLR is above the long-term average.
The discussion between manacker and myself was specifically about the post 1993 period, not the whole twentieth century.
I’ve noted in a previous post that: Both in the IPCC report and in our discussion it is noted that ‘accelerations’ of similar magnitude have been observed at other points in the last 150 years.
Yes, and if it doesn’t go back down, like it always has and like it appears to be in the process of doing, then you have an argument. Until such time as that happens it is similar to blaming summer on climate change and hardly worth discussing. There is NO long range satellite record. When there is one it may be meaningful. Until such time as that happens it isn’t. Comparing to tide gauges is unacceptable since they do not measure the same thing.
A brief synopsis for those late to the thread:
manacker made 3 statements: a) that there has been no acceleration in rate of global SL rise over the 20th century, b) that there has been no acceleration in rate of global SL rise over the last decade of the 20th century compared to earlier longer periods and c) that there has been no acceleration in rate of global SL rise in the 20th century compared to the 19th century.
a has not been disputed.
c has been agreed to be incorrect as stated.
The current discussion, on which you stumbled, is about c – acceleration of SLR in the last decade of the 20th Century (or 1993-2003 when the IPCC has been brought up; it doesn’t make much difference). That’s it. The statement: Yes, and if it doesn’t go back down, like it always has and like it appears to be in the process of doing, then you have an argument. doesn’t make much sense in this context since the fact that it is up now (and was up then) is the entire point at issue.
Er.. that last c should be b.
My point isn’t that you are factually inaccurate. My point is that you are making an argument of no value. It matters little what the topic was since the topic would not add any value to the argument.
My point isn’t that you are factually inaccurate.
Where?
My point is that you are making an argument of no value.
I’d agree the topic – SLR since the early 90s has been faster than the long-term average – isn’t a particularly momentous one since that’s what the data says unambiguously. To be honest I’m barely making an argument at all, just stating and restating well-established information. That’s why I was surprised when manacker disputed this basic point.
It matters little what the topic was since the topic would not add any value to the argument.
I don’t know what this is supposed to mean. An argument is about a topic so how could a topic ever add any value to an argument?
Unless you mean ‘the greater argument’? If so I agree again, it’s a very basic point. I’m not sure why you’re here declaring that though. You’ve basically wandered into a discussion, misunderstood what it was about and are now making a unilateral declaration that it has no value. If you see a discussion first find out what it is about and then, if you don’t find much value in the topic, don’t participate in it. Simple.
Couple of tidbits about Kemp et al in this article.
JCH –
From the first few paragraphs (bold added) –
the results are quite grim.
has put forward incriminating data acquired through decades that unambiguously points to a direct correlation between increase of ocean surface temperature and the rise of global sea-levels.
This is the first complete continuous sea-level reconstruction for the past 2000 years.
The trends have been compared with signs of global temperature increase and the positive correlation is too overwhelming to ignore.
You can’t be serious. Unless you’ve come over to the dark side and want to discredit the CAGW meme.
I never pay much attention to the editorial comments of bloggers as they’re usually garbage. So why pay attention to them? It’s one of the few articles that quotes authors, or reads as though there was more than one author: Mann.
It addressed a question raised here:
The “team“ accounted for effects of hurricanes that generally rearrange sedimentary layers by taking samples from places that face away from the sea. Hurricane imprints are easy to read, as the sedimentary rocks show unusually high amounts of sand blown in from the sea.
JCH
Was it with you that I was discussing the work of Simon Holgate last week? If so, please read my article on SST’s-the new thread-and comment and I will catch up with you there.
tonyb
tonyb
Tony
Could you clear up some confusion I have with your Holgate 2004 and 2007 comparison chart linked in the main post? According to Figure 2 in Holgate 2007, the 2004 plot should end in 1998 and 2007 plot in 2000. Your chart appears to have this the wrong way around. It looks as though the last two years of the 2007 data have been mistakenly added on to the 2004 line.
the reader asked Holgate the following question:
SPM of AR4 says: Whether the faster rate for 1993 to 2003 reflects decadal variability or an increase in the longer-term trend is unclear. Is Holgate 2007 the answer on this question, namely that indeed it is a matter of decadal fluctuation?
to which Holgate answered:
Holgate 2007 simply builds on Holgate and Wodworth 2004 which is why the AR4 has that statement about variability. Essentially we show that there is significant decadal variability in the sea level record. As a result there is a good possibility that all the 1993 to 2003 rate shows is internal variability (despite what Rahmstorf et al might suggest in Science). I would say that we need rather more evidence than 1 decade to be sure of an acceleration. There is certainly no evidence of a 20th C acceleration though there is some to suggest an overall acceleration since the mid 1800s (Church and White, Geophysical Research Letters, 2006). – climate audit
JCH,
Could you elaborate on your point? All I’m saying here is that the plots in the linked graphic appear to be incorrect.
I think there is unanimous agreement that there is no evidence of acceleration in SLR through the 20th Century.
Between 1st half 20 C and 2nd half 20 C, agree.
tonyb thinks he knows what Holgate will say. I don’t agree. Holgate is admitting there may be an acceleration since ~1850, and he saying more time is required before concluding there has been an acceleration after 1993.
Paul S, you still don’t get it. But that’s ok. I made a similar error last fall when it cooled to 40F and I thought we had accelerated cooling. I then checked my thermometer in the fridge, which also measure air temperature although I suppose one could argue that it really doesn’t measure the same thing as the one outside, and discovered it too was 40F! Collaborating evidence! Imagine my excitement. Then i discovered much to my disappointment that fall was just part of a cycle that repeats itself every year and cooling during an expected cycle can hardly be called an acceleration of anything. If only spring hadn’t come and ruined my hypothesis. This is sort of like saying that a well established cycle of tide gauge while on the upside is an acceleration. Accelaration of what? It isn’t an acceleration of anything if you don’t compare it to a similar point in the cycle. If only I had thought of that before and compared fall temperatures to fall temperatures, it would have saved me so much thinking time.
I’m afraid it’s you who isn’t getting it. The only thing I’m saying is that the rate of SLR over 1993-2003 was greater than the long term average, in response to someone suggesting it wasn’t. I’m saying nothing about whether this accelerated rate will continue into the future.
Perhaps I’m not getting it, but if I’m not it is because you have yet to state that the graph in the IPCC report is deceptive and a simple “this may not continue in the future” type statement is misleading based upon historical observations. Isn’t that what manaker was trying to make as his main point? That and the fact you can’t compare the measuring of two completely different things. I think you have conceded the fallacy of comparing altimeters to tide gauges so now the question is: shouldn’t the IPCC have said something like it is unlikely, or even very unlikely, that the sea level rise will not decelerate based upon historical data? They toss likely and very likely around quite often in their report, don’t you think this would deserve a qualifier?
The point you aren’t getting is that the graph, the ‘splicing’ of tide gauge and satellite data, and the IPCC position on future changes are all completely irrelevant to the current discussion. As stated it is only about the question of whether or not the rate of SLR during 1993-2003 was greater than the overall rate for 1961-2003.
It might not be what you want to discuss but it was the topic of discussion and I’m not entirely sure that it has been resolved.
If manacker’s main point was about the IPCC position on future developments why is he leading with statements about Wunsch 2007 and Holgate 2007 finding 1.6mm/yr SLR for 1993-2003, suggesting that the period is in-line with the long-term average?
I think you’re also missing the point about his criticism of satellite and tide gauge comparisons. He essentially believes it was wrong to ‘splice’ satellite altimetry data with global tide gauge records because, he thinks, only the satellite data showed above average SLR:
‘It is very clear to me that tide gauge records showed a significantly lower rate of rise over the IPCC “poster period” of 1993-2003 than the satellite altimetry record cited by IPCC.’
With that out of the way I’ll address some of the points you make here, although you should note this is an entirely separate discussion.
Which sea level graph in the IPCC report is deceptive?
Altimetry satellites and tide gauges are two devices that can be used to build global records of sea level change. Comparing these records to see if any significant differences emerge is exactly what must be done. I really have no idea why you think they shouldn’t be compared. The fact that they use different methods is exactly why they should.
I think the IPCC statement well reflected the opinions and information of the time. It was unknown and, to some extent, still is unknown if the current ‘acceleration’ is simply a moment within a persistent 1.6-1.9mm/yr trend. The satellite data are continuing to show 3.1-3.2mm/yr, now between 1993-2011 and Church & White 2011 found a 2.8mm/yr increase between 1993-2009 with a global tide gauge reconstruction. There hasn’t been a sustained slowdown just yet.
On the other hand very recent satellite rates are lower: 2005-2011 = 1.9mm/yr and 2006-2011 = 2.2mm/yr.
Past observations can be a guide to the future. We can look to the past and see there will be variability in the rate of SLR but that doesn’t necessarily mean the past can tell us the absolute parameters of variability. At some point SLR must have been lower than 1.7mm/yr and then changed. Would the past leading up to this change have given a good indication that it was going to happen?
Now you know why we are still discussing it. You think the IPCC made a valid representation. Yes, the SLR certainly must have been lower at one time, oh and there was an ice age too so therefor it cooling when winter comes should not lead one to the conclusion that it is very likely to warm in the spring, should it?
None of that had anything to do with what I said. Might have to take this one step at a time:
1) Do you accept that the ‘present’ long-term average SLR is ~1.7mm/yr?
2) Do you accept that there must have been a time when sea level was changing at a long-term rate different to 1.7mm/yr?
3) Do you accept there must have been a period where the ‘original’ rate changed to the new one?
4) Do you think you would have been able to notice when this shift was occurring before the new rate became well-established, given a hypothetical global tide gauge network similar to today?
As an illustration of what I mean here’s a decadal SLR plot using the Jevrejeva 2008 dataset from 1700 up to about 1875. Average SLR for the period is 0.3mm/yr.
http://imageshack.us/photo/my-images/811/jevrejeva2008dec1700187.gif/
From the patterns of that graph try to guess what happens next, then look at this plot filling in to 2002:
http://imageshack.us/photo/my-images/190/jevrejeva2008dec1700200.gif/
Average SLR in the second period is 1.7mm/yr. Hopefully you can appreciate from this that ‘oscilliations’ won’t always occur within the same parameters and it may not be so easy to spot changes as they’re happening.
Of course oscillations can change in magnitude. Why don’t we wait until we have evidence it has before making sounds of alarm? At least young earthers believe the world is 6000 years old instead of 30 as it appears climate change enthusiasts believe. Now are we going to be hearing about the deceleration of sea level rise soon from our climatologists with the caveat that it may go back up again and we just don’t know? Or are we going to be hearing how this is just natural variability as has been seen multiple times in the past and we can expect the sea level rise to go up again? Want to make a bet?
‘Of course oscillations can change in magnitude.’
It’s not the magnitude or amplitude of the ‘oscillations’ you should look at. The point around which the ‘oscillations’ occur changes from just above 0 in the first half to around 1.5 in the second half without obvious warning. That is a change in long-term average.
‘Why don’t we wait until we have evidence it has before making sounds of alarm?’
No-one except yourself has talked about alarm or anything like it. Perhaps you’ve forgotten what we were discussing? Here it is: IPCC AR4 looked at high rates of recent SLR and stated it was ‘unknown’ whether this amounted purely to ‘decadal variability or an increase in the longer-term trend.’
You’ve expressed an opinion that ‘decadal variability’ should have been declared the prime suspect because the data shows large ‘oscillations’ in the past. I’ve shown that significant changes can be hidden in these large oscillations such that a permanent rate change may not be apparent until long after the fact. For me, ‘unknown’ was reasonable.
Really I think it unlikely that the underlying trend has suddenly jumped so much but I also find it plausible that we might be seeing some shift in the long-term trend. I would propose an improved IPCC statement to be: ‘It is unknown how much of this is due to decadal variability and how much is due to a change in the long-term trend.’
There comes a point in time where you just have to shrug at someone that insists on arguing the validity of the sea level rise version of weather. As far as the bet goes, I’m not sure why you would take a bet on my statement when what I predicted has already begun “Dr. James Choe, a research associate with the University of Colorado, says the decrease is temporary. “Interannual variations often cause the rate to rise or fall”, he says. Choe believes an accelerating trend will reappear within the next few years. ” So, we know a deceleration is temporary but we don’t know about an acceleration since, well, we expect one and we have confirmation bias!
http://www.dailytech.com/Defying+Predictions+Sea+Level+Rise+Begins+to+Slow/article13679.htm
Want to make a bet?
What terms are you offering?
Paul S
To summarize our agreement on sea level rise.
We have agreed on your premise “a”:
We have agreed to premise “c”
: c) that there has been an acceleration in rate of global SL rise in the 20th century compared to the 19th century (when the first half of the century is included); there has, however, been no acceleration in rate of global SL rise since the mid-19th century.
You keep dancing around the issue (your premise “b”)
blockquote> b) that there has been no acceleration in rate of global SL rise over the last decade of the 20th century compared to earlier longer periods
The period is actually 1993-2003, where Wunsch et al. (data from several sources) shows 1.6 mm/year, TOPEX/Poseidon satellite altimetry shows 2.5 mm/year, Holgate tide gauges show 1.6 mm/year and IPCC reports 3.1 mm/year (stated to be based on satellite data). IPCC compares this to a 1961-2003 average rate of 1.8 mm/year, based on a spliced record, stated to be from tide gauges to 1993 and from satellite altimetry after 1993. The Holgate tide gauge record for the period 1961-1993 shows an average of 1.5 mm/year rise over this period, so there was no significant acceleration, if one uses tide gauge records alone.
You cite Church at al. for evidence that premise “b” is incorrect (i.e. that there has been an acceleration in rate over 1993-2003 versus 1961-2003). But Church et al. measures a different time period so is not directly relevant.
In summary:
a) there has been no increase in rate of SL rise over the 20th century
b) there has been an increase in rate of SL rise over the 20th versus the entire 19th century; there has been no increase since 1850, however.
c) there has been no increase in rate of SL rise over the period 1993-2003 compared to the longer period 1961-2003, when using the same measurement methodology and scope.
Can we agree to three points now Paul?
Max
Paul S
[Am reposting – there was a problem in earlier post with formatting – please delete earlier post]
To summarize our agreement on sea level rise.
We have agreed on your premise “a”:
We have agreed to premise “c”
You keep dancing around the issue (your premise “b”)
The period is actually 1993-2003, where Wunsch et al. (data from several sources) shows 1.6 mm/year, TOPEX/Poseidon satellite altimetry shows 2.5 mm/year, Holgate tide gauges show 1.6 mm/year and IPCC reports 3.1 mm/year (stated to be based on satellite data) IPCC compares this to a 1961-2003 average rate of 1.8 mm/year, based on a spliced record, stated to be from tide gauges to 1993 and from satellite altimetry after 1993. The Holgate tide gauge record for the period 1961-1993 shows an average of 1.5 mm/year rise over this period, so there was no significant acceleration, if one uses tide gauge records alone.
You cite Church at al. for evidence that premise “b” is incorrect (i.e. that there has been an acceleration in rate over 1993-2003 versus 1961-2003). But Church et al. measures a different time period so is not directly relevant.
In summary:
a) there has been no increase in rate of SL rise over the 20th century
b) there has been an increase in rate of SL rise over the 20th versus the entire 19th century; there has been no increase since 1850, however.
c) there has been no increase in rate of SL rise over the period 1993-2003 compared to the longer period 1961-2003, when using the same measurement methodology and scope.
Can we agree to threes 3 points now Paul?
Max
The period is actually 1993-2003, where Wunsch et al. (data from several sources) shows 1.6 mm/year
As I’ve said numerous times, this result from Wunsch wt al. 2007 is an output from a GCM. This is from the abstract: ‘Estimates of regional patterns of global sea level change are obtained from a 1° horizontal resolution general circulation model’
Holgate tide gauges show 1.6 mm/year
Holgate 2007 may show something like that but the aim of the paper was not to provide accurate figures on recent SLR changes; it was to get an idea of variability using limited coverage going back to the beginning of the 20th Century. Holgate 2004 uses 177 tide gauge stations to build a global record. Holgate 2007 uses 9 stations. Which do you think should be used preferentially for accurate figures?
TOPEX/Poseidon satellite altimetry shows 2.5 mm/year
Could you cite this? Here is one analysis of the satellite data: http://sealevel.colorado.edu/ They also have links on the left to a few other analyses with pretty much identical conclusions. You can download the scatter plot data from the page and check your desired time series. When I did this for 1993-2003 I got 3.4mm/yr. I think this is higher than the figure published in AR4 because of a recent GIA (Glacial Isostatic Adjustment) correction.
You cite Church at al. for evidence that premise “b” is incorrect (i.e. that there has been an acceleration in rate over 1993-2003 versus 1961-2003). But Church et al. measures a different time period so is not directly relevant.
I’m not sure what you mean by ‘different time period’. Church & White 2006 covers 1870-2001 and the reconstructed data is available to make your own comparisons. 1961-2001 averages 1.9mm/yr. 1993-2001 averages 3.35mm/yr. I’ve subsequently cited Church & White 2011 as an update in which 1961-2003 averages 1.8mm/yr and 1993-2003 averages 2.8mm/yr.
I’ve also cited Holgate 2007 which shows 4mm/yr for 1993-2002 (no specific figure available for 1961-2002) and Jevrejeva 2008 which shows 3.6mm/yr for 1993-2002 (about 1.6mm/yr for 1961-2002).
In Summary
There is a consistent picture, from tide gauge records over the last 50 years, of global SLR averaging at around 1.6-1.9mm/yr. Equally consistent, when looking at records stringing together a reasonably large number of stations, is that SLR over the period 1993-2003 was greater than the 1961-2003 average.
I’ll reiterate, since it doesn’t seem to have sunk in with some, that I’m not saying anything about whether this accelerated rate will continue (or even ‘did continue’ since we haven’t looked beyond 2003).
Holgate acknowledges there has been an acceleration 1993-2003, but thinks it is too soon to rule out natural viability as the cause of it.
JHC, nice article on GRACE you linked above.
Steven, I could not find a copy of Quinn 2010. When I can’t find a copy of a paper online, I go look for papers that have cited the paper as that can sometimes expand a bit on the abstract.
Lol – above SB natural variability, not viability!
JCH
Holgate 2007 figures show major decadal variability over 20th century (from decades sjowing net SL decrease to decades showing an average rate of increase exceeding 5 mm/year) but no increase 1993-2003 versus longer periods.
Max
Max, this is Holgate’s statement:
As a result there is a good possibility that all the 1993 to 2003 rate shows is internal variability (despite what Rahmstorf et al might suggest in Science). I would say that we need rather more evidence than 1 decade to be sure of an acceleration. – Holgate
To me that is an acknowledgement there is an acceleration, but it is too soon to rule out the viability of natural variability.
I do not to which article Holgate is referring, but I assume it is this one:
The rate of rise for the past 20 years of the reconstructed sea level is 25% faster than the rate of rise in any 20-year period in the preceding 115 years. Again, we caution that the time interval of overlap is short, so that internal decadal climate variability could cause much of the discrepancy; …
JCH, the real issue is can you take half a cycle and form any valuable conclusion at all from the information if the half cycle you are observing is no different then previous half cycles you have observed. I would say no and that you must wait for the cycle to either fail to behave as it has in the past or to complete the cycle and then determine if there is any indication of a change of behavior. That is why Holgate says we need at least another decade to make any determination as to a change in trend. If there is a change in trend you may have an acceleration or you may have a deceleration, but to compare an up portion of an oscillation with a down portion of an oscillation is of no value that is apparent to me.
Sure it has value! You get to say, “Yep, we definitely have an oscillation here.” ;)
I think the Holgate quote I was referring to was the one that came from the later 2007 study:
The SL rate of change record is a classical sine curve with the rate of SL change varying all over the map in a regular oscillation. The amplitude is around 5 to 6mm/year (from a max decadal rate of +5.2 mm/year for the decade 1975-1985) to a min decadal rate of -1.4 mm/year for the decade 1959-1969) and an overall cycle of 10-12 years.
This pattern continued over the entire century and, as Holgate stated, the trend of the past 20 years was not particularly unusual.
As Steven and Brian H have commented “we have an oscillation”, and as Holgate added “and no trend”.
Max
What Holgate is saying is that the high SLR rate seen in the last 20 years is not recognisably different from rates in earlier periods of the twentieth century. He is not saying that the rate seen in the 90s isn’t higher than the long-term average as you have been stating.
As Steven and Brian H have commented “we have an oscillation”, and as Holgate added “and no trend”.
No-one has denied there is large variability in SLR but ‘oscillations’ have a peak and the long-term average lies below the peak. What you have been arguing is that the 1993-2003 was not a peak above the long-term average. Are you now ok with saying it was?
Regarding your amended statement c, it isn’t right because 1993-2003 almost unequivocally had a greater SLR than the average for 1961-2003. I’ve been thinking of an adequate replacement but have come to the realisation that the IPCC’s summary pretty much encapsulates everything that’s been talked about in this thread:
‘The rise in global mean sea level is accompanied by considerable decadal variability. For the period 1993 to 2003, the rate of sea level rise is estimated from observations with tide gauges as 2.8-3.6mm/year, significantly higher than the average rate. The tide gauge record indicates that similar large rates have occurred in previous 10-year periods since 1950. It is unknown whether the higher rate in 1993 to 2003 is due to decadal variability or an increase in the longer-term trend.’
http://www.ipcc.ch/publications_and_data/ar4/wg1/en/ch5s5-es.html
The bolded part is where I replaced a statement about satellite altimetry data, hopefully avoiding more red herrings about satellites vs. tide gauges.
Paul S
Depending upon which set of data one considers, the period 1993-2003 either showed an rate of SL rise that was a) higher than the 20th century average (IPCC, based on satellite altimetry), b) equal to the 20th century average (Wunsch, model study based on several sources) or c) lower than the 20th century average (Holgate 2007, based on tide gauges).
Yes. There are major decadal swings in the rate of SL rise, which exceed the average long-term rate by over three times. IPCC alluded to these, but failed to mention how much larger than the LT average they were.
So a comparison of a short-term period with a longer-term period is a red herring to start off with (as is the case with the temperature record).
This is one of the ploys IPCC has used to attempt to sell the world the concept of a late 20th century period of accelerated and unusually rapid warming or SL rise (caused by AGW, of course). The other was to change method and scope of measurement (from tide gauges to satellite altimetry)..
But, Paul, I really believe it is pointless to keep throwing out references to data to try to make the IPCC claim of accelerated rate of SL rise look reasonable when it clearly was not.
Let’s let this one lie and move on to something else.
Max
The main reason I’m pursuing this is that I’m curious how you can keep defending an untenable position.
On one hand you have (a) three global tide gauge records utilising hundreds of stations from around the world. On the other hand you have (b) an output from a GCM and (c) a tide gauge record emcompassing a total of 9 stations.
You’ve presented a, b and c as if any of the choices would be equally reasonable to accept. This simply isn’t the case. Overwhelmingly the evidence points to (a) being true.
JCH
Sorry not to have caught up with you sooner but didn’t see your post-I do find this ‘nesting’ quite awkward in many ways.
I have had quite a number of conversations with Simon over the months, some more private than others. Some of these replies are therefore paraphrased
His position is that sea level did rise faster in the first half of the 20th century than the second half, but it is statistically insignificant.
Second, referring specifically to his comments on future sea level rise;;
“No, I’ve never made any predictions regarding future sea level change. Until I feel that I have a good enough understanding of the 20th century change, I won’t do either….My comment that I think the IPCC estimates are likely to be under-estimates is entirely based on my ‘expert opinion’ so it holds no greater weight than that. (Based on GCM simulations) I also expect sea level to rise faster over the next 100 years than it did over the last hundred years. Beyond that I wouldn’t be willing to make any further assertion.”
Regarding historic sea level variations (the subject of a future article of mine)
“It seems plausible that sea level would be higher in a warmer period (how warm and how much of the Earth was actually affected by the warm period is debated) but it isn’t clear how sea level would respond. So maybe it was higher than today (Roman and MWP) , or maybe it wasn’t. We have no observations and we just don’t know. For me, there is far too much uncertainty in the ‘reconstructions’ of sea level for them to be very useful…Overall I would say that the evidence from the (Roman) fish tanks etc suggests that there has been no real change in the average height of sea level over the last c. 2000 years prior to the mid to late 1800s.”
Simon is a very cautious man which is why I find his work interesting-certain other sea leve researchers do seem to go over the top. :)
Hope this helps
tonyb
The reason ports in Kent which used to be on the coast are now miles inland is not because the sea-level is falling, but because the coast in that area is being built up rapidly by deposits of silt. It’s to do with the currents in the North Sea.
Some interesting news on the sea level front, good overview at WUWT
http://wattsupwiththat.com/2011/07/21/the-battle-over-sea-level-in-jcr/#more-43808
“A few months ago a widely-publicized article by Houston and Dean was published in the Journal of Coastal Research (and on your site), noting that although sea-level is rising; the tide gauge data does not show any increased rate of rise (acceleration) for the 20th and early 21st centuries. .
In the most recent volume of the Journal of Coastal Research, there is a point/counterpoint on this study. It was started by an attack on this paper by Rahmstorf & Vermeer and followed by a response to this by Houston & Dean. “
Thx Jeez fer the Gilligan syndrome vid. First yer jump ter apocalytic
conclusion, second, let confirmation bias rule. But on the island the
‘evidence’ was shown ter be flawed and the hypothesis was refuted
… but that’s jest in the movies, real life climate science is different.